Trendlines are one of the most simple and useful tools that traders use. Read on to find out what they are, how to draw them, and the best ways to trade based on trendlines.
What is a trendline?
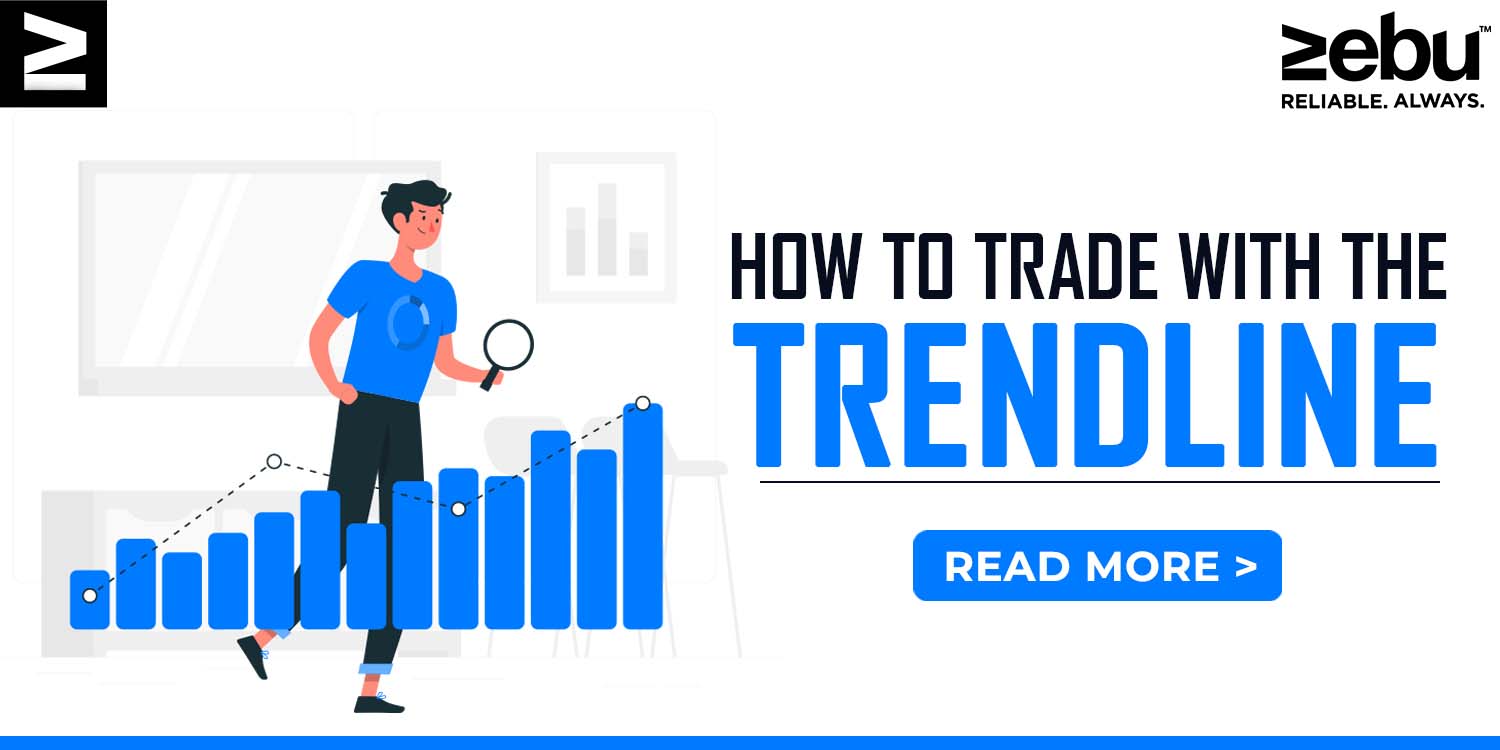
A trendline is a line that is drawn through a chart to show the trend. On price charts, trendlines are drawn to show the general direction of prices in the trading environment. Traders use this information to decide whether to buy or sell in the direction of the trend. Trendlines can be used to track the price of a stock, a currency pair, or a cryptocurrency. In technical analysis, trend lines are one of the most common ways to show how prices are moving.
A good example of how a trendline works
Usually, a trendline is made by drawing a straight line between a number of swing highs or swing lows. For an up-trend line and a down-trend line, the swing lows and swing highs are used. In this method, the trendline helps traders understand till when a trend can continue. These can also be thought of as dynamic support and resistance points.
Starting on the left side of the chart and moving the line to the right is how you draw a trendline. As a general rule, a trend line must go through at least three price “swings” before it can be taken seriously.
How to use trend lines in trading
Use a trend line to figure out the direction of the price trend. Traders can then choose to go with the trend if they think it will keep going or against the trend if they think it will change. Both strategies use the same way to read the trendline.
Bullish because the price is above the uptrend line, which means the trend is going up.
Bearish because the price is below a line that shows the price is going down.
Trend following
Trend following is a way to trade where you buy when the price is going up and sell short when the price is going down. A common trading strategy is to use an uptrend line to figure out if the general price trend is going up. A decline can also be shown by a line going down.
Trading against trend
Countertrend trading is a way to trade where you sell when the price goes up and buy when the price goes down. This is more like the basic rule of investing, “Buy low and sell high.” Reversion to the mean says that after a price trend goes in one direction, it will eventually go back to its average price. This is why short-term traders trade against the trend.
The following point is one of the most important pointers to remember while using a trendline.
Using a trendline when there is no trend is the worst mistake you can make as a beginner with trendlines. The clue is in the name!
The best angle for a trend line is 45 degrees. Even if the trend keeps going in the same direction, a slope of more than 45 degrees means that the price is going up too quickly and could easily break the trendline. Less than 45 degrees means that the trend is weaker and is almost trading sideways.
Three times in total
As a trendline goes through more swing points, more traders can see it. This makes the trendline stronger. But after five touches, the chances of the trendline “breaking” are much higher.
Zoom out
To see where the trend you’re trying to show with the trendline started, make sure to zoom out on your trading platform’s chart. For example, if you want to draw an uptrend, try to start your trendline at the bottom of the previous downtrend or at the swing low.
Five trendlines zones
Trendlines are not based on good science. Price doesn’t often hit a trendline right before it turns around. The trendlines shouldn’t be taken as a specific price but as an “area” of prices. Having this information makes it easier to choose an entry price and a stop loss.
Leave a Reply