Category: Futures and Options

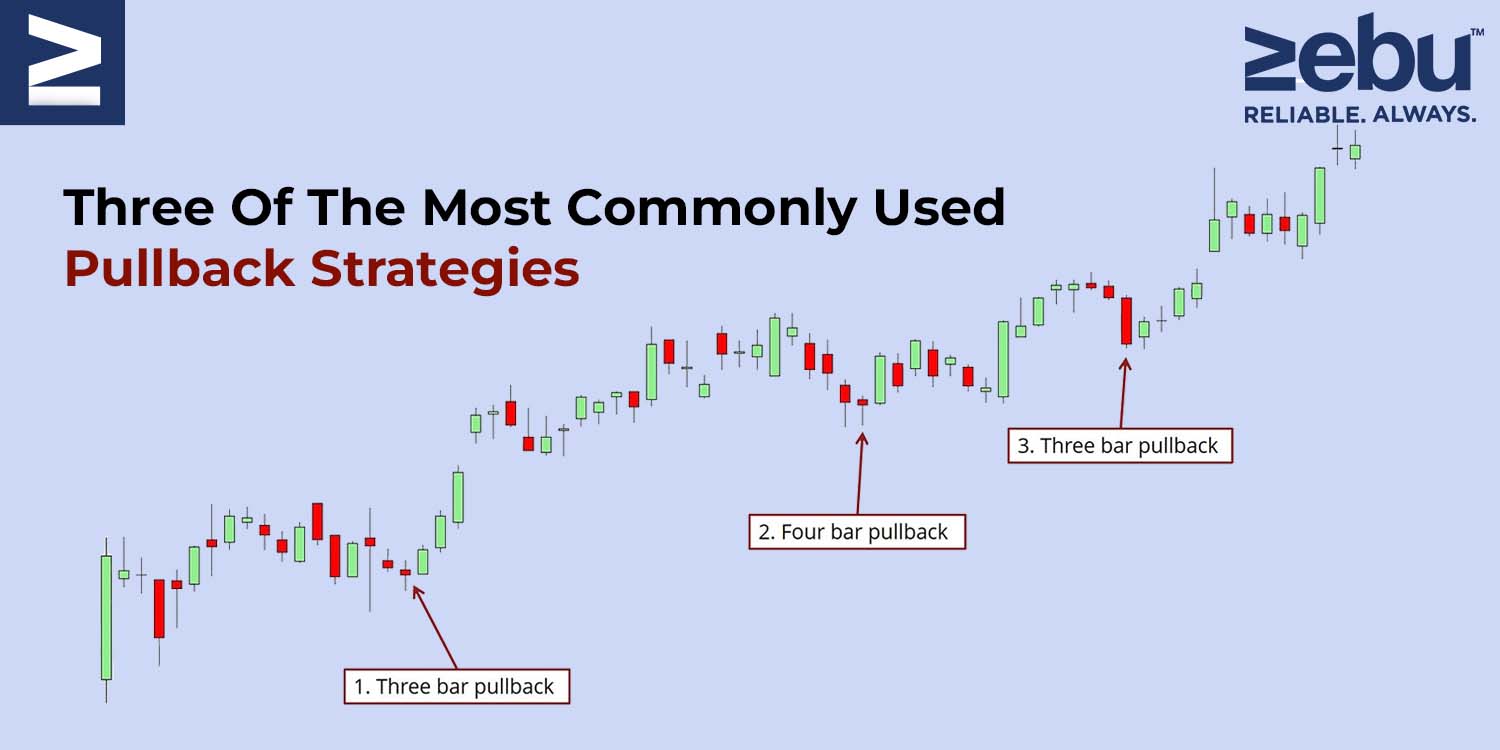
  • Three Of The Most Commonly Used Pullback Strategies

    Are you aware that one of the most fundamental trading methods is to trade trend pullbacks? Yes! There are numerous strategies to earn from pullback trading.

    You may profit from trading pullbacks across all time frames. This is because a trend can occur on any time scale, from the 5-minute to the monthly.

    Before we get into commonly used pullback strategies we would like you to know that at Zebu, one of the fastest-growing brokerage firms in the country, we have created the best Indian trading platform with the lowest brokerage for intraday trading.


    In today’s blog, we’ll present six profitable pullback trading strategies, but first, let’s define pullback trading:

    What does the term “Pullback Trading” mean?

    A pullback is a temporary halt or little decline in the price of a stock or commodity that occurs during an ongoing increase.

    A pullback is virtually synonymous with retracement or consolidation. The term “pullback” refers to brief price drops – say, a few consecutive sessions – before the uptrend resumes.

    Following a significant upward price movement, pullbacks are sometimes considered as buying opportunities.

    For instance, following a great earnings report, a stock may have a significant jump before reversing as traders liquidate existing positions. On the other side, positive earnings are a fundamental indicator that the stock will continue to climb.

    Most pullbacks see a security’s price move to a technical support level, such as a moving average or pivot point, before resuming its uptrend. Traders should pay special attention to these important support levels, as a breach below them may indicate a reversal rather than a retreat.

    Now that we understand what pullback trading is, let us explore several tactics for trading pullbacks:

    1. Pullback to a trendline
    Determining the trend’s direction should be quite straightforward. The swing high and low structure is the most straightforward way to recognise a trend.

    An uptrend is defined by a series of higher highs followed by a series of higher lows. Whereas a downtrend is defined by a series of lower lows and lower highs.

    The disadvantage is that trendlines are frequently validated more slowly. Three contact points are required to validate a trendline. You can always link two random locations, but it is only when you reach the third that you have a true trendline.

    As a result, traders can only trade the trendline pullback at the third, fourth, or fifth contact point.

    While trendlines perform well in conjunction with other pullback tactics, as a stand-alone strategy, the trader may miss numerous opportunities if trendline validation takes an extended period of time.

    2. Pullback to moving average

    Without a question, moving averages are one of the most often utilised tools in technical analysis, and they may be used in a variety of ways. Additionally, you can utilise them to trade pullbacks.

    A moving average of 20, 50, or even 100 periods could be used. It is irrelevant because it is entirely dependent on whether you are a short-term or long-term trader.

    Shorter-term traders utilise shorter moving averages to get hints more quickly. Naturally, shorter moving averages are more prone to noise and false signals.

    On the other side, longer-term moving averages move more slowly and are less subject to noise, but may miss short-term trading opportunities. Consider the advantages and downsides for your own trading.

    3. Pullback after a breakout

    Breakout pullbacks are extremely prevalent, and probably the majority of traders trade this price action pattern.

    Pullbacks following breakouts are frequently seen at market turning points, following the price breakout of a consolidation pattern. The most often used consolidation patterns are wedges, triangles, and rectangles.

    Open range breakout is another common strategy. Once the day’s 15 minutes low and high are marked, traders enter a long position once the upper limit is broken on a good volume. In this situation, it would be ideal to wait for a pullback to the vwap or the 15-minute high for a better risk:reward potential.

    As we mentioned before, trading and investments requires the best Indian trading platform and the lowest brokerage for intraday trading.. As one of the best brokerage firms in the country, we have created a powerful trading platform that makes analysis easy for you. To know more about its features, please get in touch with us now
  • An Overview of Volume vs. Open Interest

    Volume and open interest are two of the most important technical metrics for understanding options and the broader market. The amount of contracts exchanged in a given period is referred to as “volume,” whereas “open interest” refers to the number of contracts that are active, or not settled. We’ll look at these two variables and give you some pointers on how to utilise them to better understand trade activity in the derivatives markets. But before we get into that, there is one thing you will require: the best Indian trading platform with a wide range of features. With Zebu, one of the best stock brokers in the country, your online stock trading journey will be drastically enhanced.


    Volume

    In the stock market, volume refers to the number of times shares are traded between buyers and sellers. The volume metric for options markets gives the number of options contracts bought and sold in a given trading day, as well as the degree of activity for a specific contract.

    Every transaction counts against the daily volume, whether it’s an opening or closing transaction.

    The higher the volume, the more people are concerned about security. Volume is often used by investors to determine the strength of a price movement. More volume also suggests that the contract has more liquidity; this is advantageous in short-term trading because it means that there are more buyers and sellers in the market.

    Assume that the volume in call option ABC with a strike price of Rs 1000 and a three-week expiration date did not trade any contracts on a given day. As a result, the trade volume is zero. An investor buys 15 call option contracts the next session, and there are no other trades that day, thus the volume is now 15 contracts.

    The volume and open interest measurements reveal the amount of buying and selling that supports a prospective price change. In technical analysis, however, it is also necessary to determine whether the open interest is in calls or puts, as well as whether the contracts are being purchased or sold.

    Open Interest

    The quantity of options or futures contracts owned by active traders and investors is known as open interest. These positions have been created, but they haven’t been filled, expired, or exercised yet. When buyers and sellers (or writers) of contracts close off more positions than were opened that day, open interest declines.

    A trader must take an offsetting position or exercise their option to close out a position. When investors and traders open additional new long positions or sellers take on new short positions in an amount bigger than the number of contracts that were closed that day, open interest rises once more.


    Assume that the open interest in the ABC call option is 0 for example. The next day, an investor opens a new position by purchasing 10 option contracts. The number of people who have expressed interest in this particular call option has now reached ten. Five contracts were closed the next day, ten were opened, and open interest grew by five to 15.

    Open interest, along with other variables, is used by technical analysts to determine the strength of a market trend. Increased open interest signals the entry of new traders into the market and can be used to corroborate a current market trend. The current trend may be deteriorating as open interest declines, indicating that traders are closing their positions.

    Particular Points to Consider

    We’ve listed a few situations that include the volume and open interest indicators, as well as some possible interpretations.

    Rising prices during an uptrend, combined with rising open interest, can indicate that new money is entering the market (reflecting new positions). If long positions are fueling the growth in open interest, this might be an indication of a bullish mood.
    If, on the other hand, open interest falls while prices rise during an advance, this could imply that money is leaving the market, which is a bearish indicator.
    If, on the other hand, open interest falls while prices rise during an advance, this could imply that money is leaving the market, which is a bearish indicator.
    Prices falling in a downtrend while open interest rises could indicate that new money is entering the market on the short side. This scenario is negative since it is consistent with a continuous downtrend. However, falling prices in a downtrend with declining open interest may imply that holders are being compelled to liquidate their positions, which is a bearish indicator.

    If open interest is high as prices are falling sharply during a market peak, it could be a bearish indicator if those who bought near the top are suddenly losing money; this could also create a panic selling scenario.

    Option Chain And Its Working

    An option chain is a table that lists all of the available options for a certain security. An option chain displays all of the published calls and puts for a given expiry date, organised by characteristics such as strike price, expiration date, volume, and pricing.

    How much open interest and volume should an option have?
    In general, a high volume and open interest both indicate a liquid market with a large number of buyers and sellers for a specific option. Market mood can also be confirmed by changes in open interest and volume. A rising price with increasing volume and open interest, for example, indicates a robust market, whereas a rising price with declining volume and open interest indicates a weak market.

    When the Volume Exceeds the Open Interest, What Does It Mean?

    If an option has a high volume but a low open interest, it has a limited secondary market, which means it may have low liquidity. A trader trying to sell that option might have trouble finding a buyer, or they might face a wider bid-ask spread than usual.

    What Does a High Open Interest Indicator Indicate?

    A huge number of traders have taken active positions in an options or futures contract with a high open interest. If open interest rises over time, it indicates that new traders are taking positions in the market and that money is flowing in. When open interest decreases over time, it indicates that traders are beginning to close positions.

  • The Ultra-Beginner Guide For Expiry Date

    An expiry date usually refers to the last day when a product or service can be used. Expiry marks the conclusion of a contract or an asset in the market. When trading in the derivatives market, such as futures and options contracts, the expiry date refers to the contract’s final date after which it will no longer be valid.

    When a derivatives contract reaches its expiration date, it has a variety of consequences for derivative traders as well as the Indian stock market as a whole.

    Before we get into the basics of expiry trading, it’s important to know that expiry day trading is extremely risky and it takes a certain level of experience before you can become profitable. However, if you would like to get started with options and futures analysis, you need access to the best trading platform from one of the best online share brokers in the country. At Zebu, we give you all of this and more – we also offer the lowest brokerage for intraday trading.

    The meaning of derivatives contracts

    Futures and options contracts on stocks, commodities, currencies, and other assets are examples of derivative contracts. Futures and options are similar in that they both convey a guarantee to buy or sell an asset at a certain price at a future date. But that’s where the resemblance ends.

    You are not obligated to keep your pledge under an Options contract. You can simply choose to ignore the contract, and it will end on the agreed-upon date. A Futures contract, on the other hand, requires you to complete the deal by the expiration date. You must not allow the contract to lapse. This is what distinguishes futures from options.

    The Indian stock exchange has a predetermined standard expiry date for the F & O market to remove any confusion among traders. Every month on the last Thursday, we call it an expiry day.

    For example, if you buy a futures contract on January 14th, 2022, the contract will expire on January 27th, 2022, the last Thursday of the month.

    If the final Thursday of the month is a trading holiday, meaning the stock market is closed on that day, the previous day, i.e. the last Wednesday of the month, is the expiry date.

    Please note that Nifty and Bank Nifty indices have weekly expiries which happen every Thursday of the week. And stocks have a monthly expiry which is the last Thursday of the month.

    What happens during the expiry date?
    Here’s what occurs when a derivatives contract reaches its expiration date in different sorts of contracts —

    Options Contracts

    You are not obligated to fulfil the contract in the case of options contracts. As a result, if the contract is not used before the expiration date, it will simply expire. The seller forfeits the premium you paid to purchase the option. You don’t have to pay any additional fees.

    Futures Contracts

    You would have to fulfil the deal on the expiration date if you were to use a futures contract. This happens in two ways.

    You can purchase a new contract to replace the existing futures contract. Assume you purchased a futures contract to purchase 1000 shares of XYZ Company. You can buy another futures contract to sell 1000 shares of XYZ firm on the expiration date.

    The first contract to sell the shares is nullified by this new contract, which will now be in your position. You would have to settle the price discrepancy, if any, in such cases. The price difference is due to the difference in the futures contract’s price. Because stock prices fluctuate every day, the price of the futures contract fluctuates as well. As a result, the price of the futures contract you buy first may differ from the price of the futures contract you buy later. In such circumstances, you’ll have to pay the price difference in order to complete your contract by the expiration date.

    The impact of the stock’s expiration date on its price
    Due to the fact that the expiry date signifies the end of F&O contracts, there is a lot of volatility on the stock exchange as a whole. The stock market may turn bullish or bearish depending on the type of futures contracts settled on the expiry date.

    Arbitrage trading also has an impact on stock market prices towards the expiration date. Arbitrage trading is when F&O traders want to profit from the small price difference in the same security’s contracts on different expiry dates. They might buy on the secondary market and sell on the F & O market, or the other way around. Price changes from this buying and selling have an impact on the stock market as a whole. However, this effect is just temporary, as the stock market corrects itself once the expiration date has passed.

    In Conclusion

    Know the expiry date of the derivative contracts you buy if you trade futures and options. The settlement of your contracts is determined by the expiry date, and you should be aware of what happens on that date. Also, as a stock trader, you should be aware of the impact of the expiry date on the overall stock market. Due to increased volatility around the expiry date, you can either book short-term profits or avoid trading altogether to reduce losses.

    As we mentioned before, this is the most basic introduction to what happens on an expiry day. In future articles, we will get into more details about a few popular expiry day strategies. For now, you just need to understand that to get started with futures and options analysis, you need the lowest brokerage for intraday trading as well as the best trading platform. As a leading online share broker, we at Zebu have created the perfect trading platform with an extensive amount of features to make trading simply for you.

  • Leading And Lagging Indicators For Beginners

    For those who trade using technical analysis, technical indicators are the core of their trading.

    Whether you day trade or swing trade, these indicators are extremely important. Technical analysis’ principal purpose is to forecast future price movement. Understanding the art of trading patterns and indicators will help you in understanding them better.

    Technical indicators are separated into two types: leading and lagging indicators.

    In this post, we’ll look at both types of indicators to see which one best suits your trading style. But before we begin, let’s talk about access to indicators. When you start trading, it is important to have one of the best trading accounts from the best share broker in terms of the number of indicators you can use. Zebull Smart Trader is a high-end online trading platform that gives you the widest range of leading as well as lagging indicators for you to choose from. With us, you can execute any complex strategy with any number of indicators.

    What is a Leading Technical Indicator, and how does it work?

    Leading indicators are used to anticipate future price changes and provide a trading advantage to the trader.

    Leading indicators provide an early signal of entry or exit and show price momentum over a period of time that is utilised to calculate the indicator.

    The following are some well-known leading indicators:

    Stochastic Oscillator
    RSI
    Volume
    William % R
    Volume profile

    Because volume gives us the buying and selling pressures in the market, it tends to indicate changes even before the price moves. For example, when a market top is formed, you can clearly see an exhaustion of buyers. If that is followed by an increasing number of sellers, then you can assume that the trend has reversed.

    What is a Lagging Technical Indicator, and how does it work?

    Lagging indicators are price reversal indicators that follow a trend and predict price reversals.

    These are especially useful if you follow a trend following strategy.

    They don’t predict future price changes; instead, they just notify us whether prices are rising or falling so that we can invest accordingly.

    Despite the delayed feedback, many traders prefer lagging indicators since they let them trade with greater confidence by confirming their results.

    Before buying a stock, traders usually employ two or more lagging indicators to confirm price movements.

    Examples of lagging indicators:

    Moving Averages
    Moving averages convergence and divergence

    Let’s look at an example:

    A 50 period 200 period moving average is a typical example of a lagging indicator setup.

    When the 50 MA crosses below the 200 SMA, a security is said to be bearish. When the 50 MA crosses above the 200 SMA, a security is considered to be bullish.

    If you consider the first signal from the moving average crossover and execute your trades, they might end up in a loss.

    The key reason for this is that by the time the price moves lower and the SMAs respond, the price would have already dropped significantly and reversed.

    Similarly, when we receive a bullish crossover indication, it is better to wait for a pullback before entering a trade.

    What is the difference between the two types of indicators?

    Signal Generation
    Leading indicators provide trading signals when a trend is about to begin, whilst lagging indicators track price movements.

    Time Periods to Avoid
    Leading indicators attempt to predict price using a shorter timeframe and, as a result, trail price fluctuations.

    Lagging Indicators provide signals after a trend or reversal has occurred. They can be used to determine the direction of the trend.

    Drawbacks of leading and lagging indicators

    Leading indicators are prone to false signals because they react quickly to price changes.

    Lagging indicators take a long time to react and might also send out false signals.

    Using Leading and Lagging Technical Indicators in Combination
    Traders can use a combination of a leading and lagging indicator to create a better trading system. For example, you can use RSI and Moving average crossover. In this strategy, you can wait for a buy/sell signal from RSI (a leading indicator) and wait for a confirmation from the moving average crossover to initiate a trade. Combining leading and lagging indicators can be a simple but powerful way to trade.

    Creating a trading strategy is an art. You need the best trading accounts from the best share broker to give you access to all types of leading and lagging indicators. This is exactly what we offer at Zebu. We have created a highly advanced online trading platform that helps you take the best possible trades with a host of indicators. To know more about Zebull Smart Trader, please get in touch with us now.

  • Strangles And Straddles For Beginners

    Both strangles and straddles are options techniques that allow an investor to profit from big price changes in a company, whether the stock moves up or down. Both strategies involve purchasing an equal number of call and put options that expire on the same day.

    Option prices are intrinsically related to the price of something else, making them a sort of derivative security. You have the right, but not the responsibility, to buy or sell an underlying asset at a specified price on or before a specific date if you purchase an options contract.

    A call option allows the holder to purchase stock, whereas a put option allows the holder to sell shares. An option contract’s strike price is the price at which an underlying stock can be purchased or sold. Before a position can be closed for a profit, the stock must rise above this price for calls and fall below this price for puts.

    Before we give you an explainer of the strangle and straddle, it is important to know that you need to analyse them for maximum profits. At Zebu, one of the fastest-growing brokerage firms in the country, we have created the best Indian trading platform with the lowest brokerage for intraday trading. If you would like to simplify your option trading game, we are here to help you out.

    Options Straddle

    A straddle trade is one technique for a trader to profit on an underlying asset’s price change. Let’s imagine a company’s latest earnings are due in three weeks, and you have no idea whether the news will be positive or negative. Because the stock is expected to go dramatically higher or down when the results are published, the weeks leading up to the news release are an excellent opportunity to enter into a straddle.

    Let’s pretend that the stock is trading at Rs 1000 in April. Assume the price of a Rs 1000 call option for June is Rs 20 and the price of a Rs 1000 put option for June is Rs 10. A straddle is created by buying both the call and the put options. If the lot size is 200, your total investment would be (20+10)*100 = Rs 3000.

    The straddle will gain value if the stock rises (because of the long call option) or falls (due to the short call option) (because of the long put option). Profits will be achieved as long as the stock price swings in either direction by more than Rs 30 per share.

    Profits will be achieved as long as the stock price swings in either direction by more than Rs 30 per share. Since ATM options are bought, this strategy is called a long straddle. Traders with large capitals often choose short straddles to make additional income.

    In short straddle, instead of buying the ATM call and put options, traders sell them. It is a directionally neutral strategy.

    Options Strangle

    The improvisation of the strangle over the straddle mostly helps in lowering the strategy cost. But, the number of points required to break even rises.

    The strangle requires the purchase of OTM call and put options. Remember that the OTM strike is usually cheaper than the ATM strike, therefore setting up a strangle is less expensive than setting up a straddle.

    For example, if the Nifty is currently trading at 7921, we’ll need to buy OTM Call and Put options to put up a strangle. Keep in mind that both options must have the same expiration date and underlying.

    Assume you purchase OTM options with a 200-point spread. As a result, you would purchase the 7700 Put option and the 8100 Call option. These options are currently trading at a price of Rs 20 and 30, respectively. The total premium for executing the strangle is 50. Nifty must expire above 8100 or below 7700 to be profitable in this method.

    When you sell OTM options, then it is called a short strangle. It is a neutral strategy that is profitable if the underlying expires between the two strikes of the OTM options.

    While this is just an overview of the strangle and straddle, two of the most common options trading strategy, we will get into a detailed look at the strategies with respect to moneyness as well as option greeks in a later post.

    As we mentioned before, trading strangles and straddles requires the best Indian trading platform and the lowest brokerage for intraday trading. As one of the best brokerage firms in the country, we have created a powerful trading platform that makes option analysis easy for you. To know more about its features, please get in touch with us now.

  • Common Options Trading Mistakes And How To Avoid Them – Part 1

    When you trade options, you can make money even if stocks go up, down, or stay the same. With options trading, you can cut losses and protect gains for only a small amount of money.

    Great, right? Here’s the deal: When you trade options, you can lose more money than you invest in a short amount of time. This isn’t the same as when you buy a stock. You can only lose what you paid for the stock in that case. With options, depending on the type of trade, it’s possible to lose all of your money.

    That’s why it’s so important to be careful. Even if you’re an expert trader, you can still make a mistake and lose money.

    When it comes to online stock trading and growing your trading account, another important aspect for you to consider is the share market brokers you trust. At Zebu, we offer the best trading platform that is packed with features that will help you make better trading decisions.

    To help you avoid making costly mistakes, we’re going over the top 10 mistakes that new option traders make.

    1. Buying OTM call options

    Buying out-of-the-money (OTM) call options is the biggest mistake you can make when trading options.
    OTM call options seem like a good place to start for new options traders because they are cheap. This may feel safe to you because it’s the same thing you do as an equity trader: buy low and try to sell high. There are many ways to make money in options trading, but they are one of the most difficult. In this case, you might lose more money than you make if you only use this method.

    The smarter way to trade

    Think about selling an OTM call option on a stock that you already own as your first move. In the business world, this strategy is called a “covered call.”

    The risk doesn’t come when you sell an option when you have a stock position that covers the option. In addition, if you’re willing to sell your stock if the price goes up, it could make you money. This strategy can help you get a sense of how OTM options contract prices change as the expiration date nears and the stock price changes.

    It’s also possible to lose a lot of money by owning the stock, but that risk can be big. Even though selling the call option doesn’t put your money at risk, it does limit your chances of making money, which is called “opportunity risk.” You could have to sell the stock if the market rises and your call is taken.

    2. Not Knowing How Leverage Works

    Most people who start trading don’t think about how much risk they’re taking when they use the leverage factor in option contracts. They like to buy short-term calls. As a result of this happening so often, it’s worth asking: Is buying calls outright a risky or safe strategy?

    3. The smarter way to trade

    A general rule for new option traders: If you usually trade 100 share lots, stick with one option at first and start with that. If you usually trade 300 shares at a time, then maybe three contracts would be a good change of pace. This is a good amount to start out with. If you don’t do well with these sizes, you’ll probably not do well with bigger size trades, too. This is a general rule.

    4. Not having an exit plan

    You may have heard it before: When you trade options, like stocks, it’s important to keep your emotions in check. The point isn’t to be able to overcome all of your fears in a superhuman way.

    Having an exit plan even when things are going your way is part of this. Take the time to figure out where you want to leave and when you want to leave.

    If you start to worry about leaving some money on the table by getting out too early, don’t worry. Remember this counterargument: What if you made more money consistently, cut down on your losses, and slept better at night?

    5. The smarter way to trade

    Make sure you know how you’ll leave a trade. Whether you are buying or selling options, having an exit plan can help you set up better trading habits and keep your fears in check.

    Determine how you want to get out of the situation on the upside and how much you can handle on the other side. In the event that you reach your upside goals, you should clear your position and take your money. Don’t be too greedy. If you hit your stop-loss on the downside, you should clear your position again and start a new one. Don’t stay in a losing trade hoping that the prices may rise again.

    A lot of times, it’ll be hard not to go against this way of thinking. Don’t. Too many traders make a plan and then, as soon as they make a trade, ditch their plan and follow their feelings instead.

    Online stock trading requires you to stick to your plan and use the right market brokers to grow your trading account. At Zebu, we offer the best trading platform that is packed with features that will help you make better trading decisions. If you would like to know more, please get in touch with us now.

  • Let’s Make Sense Of Option Greeks – Part 2

    In the last article, we got to understand the basics of what moves an option’s premium. There are several factors like implied volatility, moneyness and time to decay that affect its price. In this article, we take a detailed look at each of the options Greeks and how they work.

    Before we begin…
    As we have mentioned in part 1, Zebu is fast emerging as the top broker in share market and provides the lowest brokerage for intraday trading. As an options trader, we will complement your strategies with Zebull, the best Indian trading platform. It comes with a variety of features that will help you analyse option greeks effortlessly.

    For every 1 Re change in the price of the underlying securities or index, Delta estimates how much an option’s price can be expected to vary. A Delta of 0.40, for example, suggests that the option’s price will move 40 paisa for every 1 Re movement in the price of the underlying stock or index. As you may expect, the higher the Delta, the greater the price variation.

    Traders frequently utilise Delta to determine whether an option will expire in the money. A Delta of 0.40 is taken to signify that the option has a 40% chance of being ITM at expiration at that point in time. This isn’t to say that higher-Delta options aren’t profitable. After all, you might not make any money if you paid a high premium for an option that expires ITM.

    Delta can alternatively be thought of as the number of shares of the underlying stock that the option mimics. A Delta of 0.40 indicates that if the underlying stock moves 1 Re, the option will likely gain or lose the same amount as 40 shares of the stock.

    Call Options

    The positive Delta of call options can range from 0.00 to 1.00.
    The Delta of at-the-money options is usually around 0.50.
    As the option’s price goes deeper into the money, the Delta will rise till it eventually reaches 1.
    As expiration approaches, the Delta of ITM call options will approach 1.00.
    As expiration approaches, the Delta of out-of-the-money call options will almost go down to 0.00.

    Put Options

    The negative Delta of put options can range from 0.00 to –1.00.
    The Delta of at-the-money options is usually around –0.50.
    As the option goes deeper ITM, the Delta will fall (and approach –1.00).
    As expiration approaches, the Delta of ITM put options will reach –1.00.
    As expiration approaches, the Delta of out-of-the-money put options will almost go down to 0.00.

    Gamma

    Gamma represents the rate of change in an option’s Delta over time, whereas Delta is a snapshot in time. You can think of Delta as speed and Gamma as acceleration if you remember your high school physics lesson. Gamma is the rate of change in an option’s Delta per 1 Re change in the underlying stock price in practice.

    We imagined a Delta of.40 choice in the previous case. The option’s Delta is no longer 0.40 if the underlying stock moves 1 Re and the option moves 40 paise with it. Why? The call option is now considerably deeper ITM, and its Delta should move even closer to 1.00 as a result of this 1 Re move. Assume that the Delta is now 0.55 as a result of this. The Gamma of the choice is 0.15, which is the difference in Delta from 0.40 to 0.55.

    Gamma falls when an option acquires further ITM and Delta approaches 1.00 since Delta can’t reach 1.00. After all, when you near top speed, there’s less room for acceleration.

    Theta

    If all other factors remain constant, theta informs you how much the price of an option should decline each day as it approaches expiration. Time decay is the term for this type of price depreciation over time.

    Time-value erosion is not linear, which means that as expiry approaches, the price erosion of at-the-money (ATM), just slightly out-of-the-money, and ITM options generally increases, whereas the price erosion of far out-of-the-money (OOTM) options generally drops.

    Vega

    Vega is the rate of change in an option’s price per one percentage point change in the underlying stock’s implied volatility. Vega is used to estimate how much the price of an option would vary with respect to the volatility of the underlying.

    More information on Vega:

    One of the most important elements impacting the value of options is volatility.
    Both calls and puts will likely lose value if Vega falls.
    A rise in Vega will normally raise the value of both calls and puts.

    If you ignore Vega, you may end up paying too much for your options. When all other conditions are equal, consider purchasing options when Vega is below “normal” levels and selling options when Vega is above “normal” levels when choosing a strategy for options trading. Analysing the implied volatility with respect to the historical volatility is one approach to analyse this.

    Implied volatility

    Despite the fact that implied volatility is not a Greek, it is still important. Implied volatility is a prediction of how volatile an underlying stock will be in the future, but it’s only an estimate. While it is possible to predict a stock’s future movements by looking at its historical volatility, among other things, the implied volatility reflected in an option’s price is an inference based on a variety of other factors, including upcoming earnings reports, merger and acquisition rumours, pending product launches, and so on.

    These are the different option greeks that you need to use in conjunction with other bullish and bearish strategies and mathematical models that you might use to determine market moves.

    As the top broker in the share market, we have created Zebull. the best Indian trading platform with the lowest brokerage for intraday trading. With Zebull, you can easily analyse option Greeks and filter out stocks that work for you.


  • Let’s Make Sense Of Option Greeks – Part 1

    A lot of factors influence an option’s pricing, which can benefit or hurt traders depending on their positions. The “Greeks” are a set of risk metrics named after the Greek letters that identify them, which reflect how sensitive an option is to time-value decay, changes in implied volatility, and movements in the price of its underlying security.

    Theta, vega, delta, and gamma are the four basic Greek risk measurements. Here’s a closer look at each.

    Before we begin…
    Options trading can be extremely profitable if done with the right trading system and with discipline. However, you need to back up your strategy with the best Indian trading platform like Zebull from Zebu. We provide one of the lowest brokerages for intraday trading and are one of the top brokers in the share market right now. And we would love to help you with your options strategy execution.

    Why option Greeks
    For the uninitiated, options can be exercised, or converted into shares of the underlying asset, at a set price. Every option has an expiration date and a premium connected with it. One of the most popular option pricing models is Black-Scholes, which leads to price fluctuations. Greeks are frequently viewed alongside an option price model to properly assess risk.

    Volatility
    Volatility refers to how much an option’s premium (or market value) changes before expiration. Financial, economic, and geopolitical risks can all create price changes.

    Implied volatility measures the market’s expectation of price movement. Investors use implied volatility (or implied vol) to forecast future price movements in a securities or company. If implied volatility is predicted to rise, the premium on an option will likely rise as well.

    Profitability
    Several words describe a profitable or unprofitable option. The intrinsic value is the difference between the strike price and the price of the underlying stock or asset.

    At-the-money options have the same strike price as the underlying asset. An in-the-money option has a profit because the strike price is higher than the underlying price.

    In contrast, an out-of-the-money option has no profit when compared to the underlying’s price. In the case of a call option, the underlying price is less than the strike price. A put option is OTM when the underlying price exceeds the strike price.

    Influences on an Option’s Price
    Assuming other variables stay constant, an increase in implied volatility increases an option’s price.

    Traders that are long or short will have different returns. If a trader is long a call option, increased implied volatility is beneficial since it increases the option premium. For traders holding short call options, an increase in implied volatility has the opposite (or negative) effect.

    A surge in volatility would not assist a naked option writer because they want the option’s price to fall. Writers are option sellers. If a writer sells a call option, the buyer will exercise the option if the stock price rises above the strike. That is, if the stock price rose enough, the seller would have to sell shares to the option holder at the strike price.

    Sellers of options are compensated for the risk of their options being exercised against them. This is called shorting.

    A decrease in implied volatility, shorter expiration time, and a decline in the underlying security’s price favour the short call holder.

    Increasing volatility, time left on the option, and underlying will benefit long call holders.

    Indicated volatility decreases, time till expiration increases, and the price of the underlying security rises for short put holders, whereas long puts profit from an increase in implied volatility, time until expiration increases, and the underlying security price decreases.

    During the life of most option deals, interest rates play a little influence. Its impact on an option’s price is measured by rho, a lesser-known Greek. Generally, higher interest rates make call options more expensive and put options cheaper.

    All of this sets the stage for examining the risk categories used to assess these variables’ relative impact.

    Remember that the Greeks help traders forecast price fluctuations. In this article, we have laid a foundation on what moves an option price. In the next article, let’s take a closer look at the different Greeks in an option.

    At Zebu, we strive to provide our customers with the lowest brokerage for intraday trading. Zebull is our proprietary trading platform that lets you analyse option greeks to perfection and is growing fast to become the best Indian trading platform. As one of the top brokers in share market, we believe that we have the right products and features to help you make the best trades. Please get in touch with us to know more.