Category: Stocks

  • Understanding Stock Splits And Its Impact On The Share Price


    Title Page Separator Site title

    Every investor looks to the stock market for shares that will make him money. But sometimes investors can’t buy shares of a popular company. The reason is that the share price is so high. Companies decide to split their shares when this happens.

    Stock split, as the name suggests, is when the face value of a stock goes down and the number of outstanding shares goes up at the same time. The main goal of a stock split is to make the stock easier to buy and sell, so that investors can buy more of it. Companies do stock splits when they realise that the price of their shares is too high or is higher than the prices of their peers.

    For example, if a company does a 1:10 stock split, a stock with a face value of INR 1000 is split into 10 shares with a face value of INR 100. But keep in mind that the company’s share capital doesn’t change. This means that a stock split is nothing more than a cosmetic change, and that the news of a stock split won’t affect the price of the stock in a way that will lead to unusually high returns. Even if there is information in the announcement, it is most likely to show up as unusual returns on the day of the announcement, which is called the record date.

    There are some ideas about why companies split their stocks:
    Signaling: a stock split is a sign that the company will grow in the future. This is because real-world studies of stock splits in developed economies have shown that the day after the announcement of a stock split, returns are often unusual.

    Optimal trading range:

    On every stock market, stocks tend to trade in a certain range. As we’ve already said, stock splits are done to get the price of the stock back into the normal trading range. This lets more investors buy shares.

    According to this theory, the goal of bringing the stock price back to the usual trading range is to improve liquidity, which will lead to investors making more money.

    This is a way for small or ignored firms to get the attention of the market. This is done by a company that feels it has been undervalued in the market because market participants haven’t shown much interest. So, companies use stock splits to get more attention and make sure that more investors can get information about the company. This is more important for small businesses than for big businesses.

    What do investors get out of a stock split?

    In a stock split, the number of shares goes up, but the value of each share goes down. This makes it easier for new investors to get interested in the company’s stock and buy some. In other words, the number of shareholders could grow if more investors bought at lower prices.

    It looks like investors who bought the split share at a lower price may not benefit from the stock split. But if the share price goes up, it could be because of a stock split. This tells the market that the share price of the company has been going up before the split, so investors think that the growth will continue in the future.

    So, after a stock split, should you buy a share?
    Before 1999, SEBI only let INR 10 and INR 100 be used as face values. Today, the split ratio can be 2:1, 10:1, 5:1, or any other number.

    A few reports suggest that the trading range theory is wrong because most stock splits are announced for stocks that were already trading at low prices.

    So, market experts have seen that the price of a share after a stock split depends on how the market is doing and how well the company is doing. Before investing in a share after a stock split, make sure you keep the above two points in mind. There’s no need to say that the market will always have mixed feelings about stock splits. Also, one last thing: don’t confuse a bonus with a stock split. Bonus shares only change the company’s issued share capital. A stock split, on the other hand, changes the company’s authorised share capital.


  • How Exactly Do Dividends Work?

    Corporate actions are measures that a company does that change the value of its stock. There are different kinds of corporate actions that a company can take. If you understand these corporate actions well, you can get a clear picture of the company’s financial health and decide if you want to buy or sell a certain stock.

    Dividends and How They Affect Price

    A company gives dividends to the people who own shares in it. Dividends are a way for a company to share the money it made during the year. Dividends are paid out based on each share. Consider the face value of a company to be Rs 10. If it declares dividends of Rs 40 per share. This means that the dividend payout is 400%.

    Please keep in mind that dividends are not necessarily paid out every year. If the company thinks that instead of giving dividends to shareholders, it would be better to use that money to fund a new project that will help the company in the long run, it can do that.

    Also, dividends don’t have to be paid out of profits alone. If the company lost money during the year but has a healthy cash reserve, it can still pay dividends out of the cash reserve.

    During the financial year, dividends can be paid at any time. If it is paid during the financial year, it is called an interim dividend and if the payout is at the end of the FY, it is a “final dividend.”

    Sometimes giving out dividends could be the best thing for the company to do. When the company has no more ways to grow and has extra cash, it would make sense for the company to reward its shareholders. This would be a way for the company to repay the trust that its shareholders have in the company.

    At the Annual General Meeting (AGM), where the company’s directors meet, the decision to pay a dividend is made. Dividends are not paid out as soon as they are announced. This is because the shares are traded throughout the year, and it would be hard to tell who gets the dividend and who doesn’t.

    Here are the important dates you should know.

    Date of Dividend Declaration: This is when the Annual General Meeting (AGM) takes place and the board of directors of the company approves the dividend issue.

    This is the date that the company decides to look at the list of shareholders to see who is eligible for the dividend. Most of the time, there are 30 days between the dividend announcement date and the record date.

    Ex-Date/Ex-Dividend Date: The ex-dividend date is usually set two business days before the record date. The dividend is only given to shareholders who owned the shares before the ex-dividend date. This is because normal settlement time in India is T+2. So, if you want to get a dividend, you should buy the shares before the ex-dividend date.

    Date of Dividend Payout: This is the date when dividends are given to shareholders who are listed in the company’s register.

    Cum Dividend: Shared are considered cum dividend will the ex-dividend date, which means that the dividends are about to be paid.

    When a stock goes ex-dividend, its price usually goes down by the amount of dividends paid. For instance, if Reliance is currently trading at Rs. 2,800 and has announced a dividend of Rs. 100, on the ex-date, the price of the stock will go down by the amount of the dividend paid. In this case, the price of Reliance will go down to Rs. 2,700. The price falls because the company no longer owns the money that was paid out.


  • Types Of Stocks In The Indian Share Market – Part 2

    In the previous blog, we discussed a few important types of stocks. Now, let’s look at the other major categories.

    5. Value Stocks

    These are stocks that are trading below their worth or intrinsic value. What exactly is intrinsic value?

    It is the true worth of the company based on estimates rather than the market price of the company’s stocks.

    Consider the following example:

    Assume you come across a firm called Sheetal Communications, which has a current share price of Rs. 500. However, based on your calculations, the company’s intrinsic value is Rs. 600 per share. The stock market will eventually recognise the company’s true worth, and the stock will grow correspondingly.

    Value stocks are inexpensive and have the potential to generate high returns over time.

    However, both value companies and terrible stocks are available at a low valuation.

    So how do you tell the difference between the two?

    Remember that value stocks are quality businesses that have been momentarily trading at lower prices and have the ability to resurge and prosper in the future. Some possible reasons for a temporary decline include results falling short of expectations for a quarter, a brief piece of bad news riding strong sentiment but with a smaller financial impact, or simply poor market mood. Weak stocks, on the other hand, have limited liquidity, inconsistent earnings history, or poor metrics on conventional financial parameters.

    6. Growth Stocks

    You might have guessed how stocks in this category work. These are companies whose earnings are expanding faster than those of their peer group.

    However, because of their stronger growth rate, these stocks require a higher investment than their rivals. They require additional capital to expand due to their rapid growth. As a result, these stocks will pay no or very little dividends and will reinvest earnings largely in the firm.

    However, the difficulty with these stocks is that a company’s rapid growth rate does not usually last long. This means that when the company’s growth rate returns to normal, the stock price may decline with it.

    7. GARP Stocks

    GARP, or Growth at Reasonable Price, is a hybrid of growth and value investment. GARP investing identifies growth stocks that are accessible at a reasonable valuation.

    The goal is to find growth firms that consistently exhibit above-average earnings growth while trading at a low value. These equities have an average P/E ratio and a greater rate of earnings growth, resulting in a PEG ratio of one or less than one.

    However, there is a distinction between GARP and value investing.

    Value investors seek out stocks that are inexpensive, but the chance of losing money with GARP is negligible.

    8. Momentum Stocks

    Momentum stocks are based on the idea that if a stock is rising, it will continue to rise for some time. This means that investors would buy rising stocks and sell them when they appear to have peaked.

    It is usual for investors to buy up-trend momentum equities at greater prices with the hope of selling at even higher prices. Early riders on the momentum rally benefit the most.

    However, momentum can be a trap for new investors if they enter the stock too late, especially if the up-move is about to end.

    When a stock begins to rise in price, investors become concerned that they will miss the next major move and begin to buy. This causes the stock to rise even higher, and so on.

    Momentum investing is based on technical information rather than fundamentals. And, while momentum investing may not be a good option for inexperienced investors, when done correctly, it can result in remarkable profits.

    9. Income stocks

    These investors want a steady income with the possibility of capital appreciation. Income stocks are less risky than other equities in the market. Companies in the income stock category receive extra income in the form of dividends that the company pays per share.

  • Three Of The Most Commonly Used Pullback Strategies

    Are you aware that one of the most fundamental trading methods is to trade trend pullbacks? Yes! There are numerous strategies to earn from pullback trading.

    You may profit from trading pullbacks across all time frames. This is because a trend can occur on any time scale, from the 5-minute to the monthly.

    Before we get into commonly used pullback strategies we would like you to know that at Zebu, one of the fastest-growing brokerage firms in the country, we have created the best Indian trading platform with the lowest brokerage for intraday trading.


    In today’s blog, we’ll present six profitable pullback trading strategies, but first, let’s define pullback trading:

    What does the term “Pullback Trading” mean?

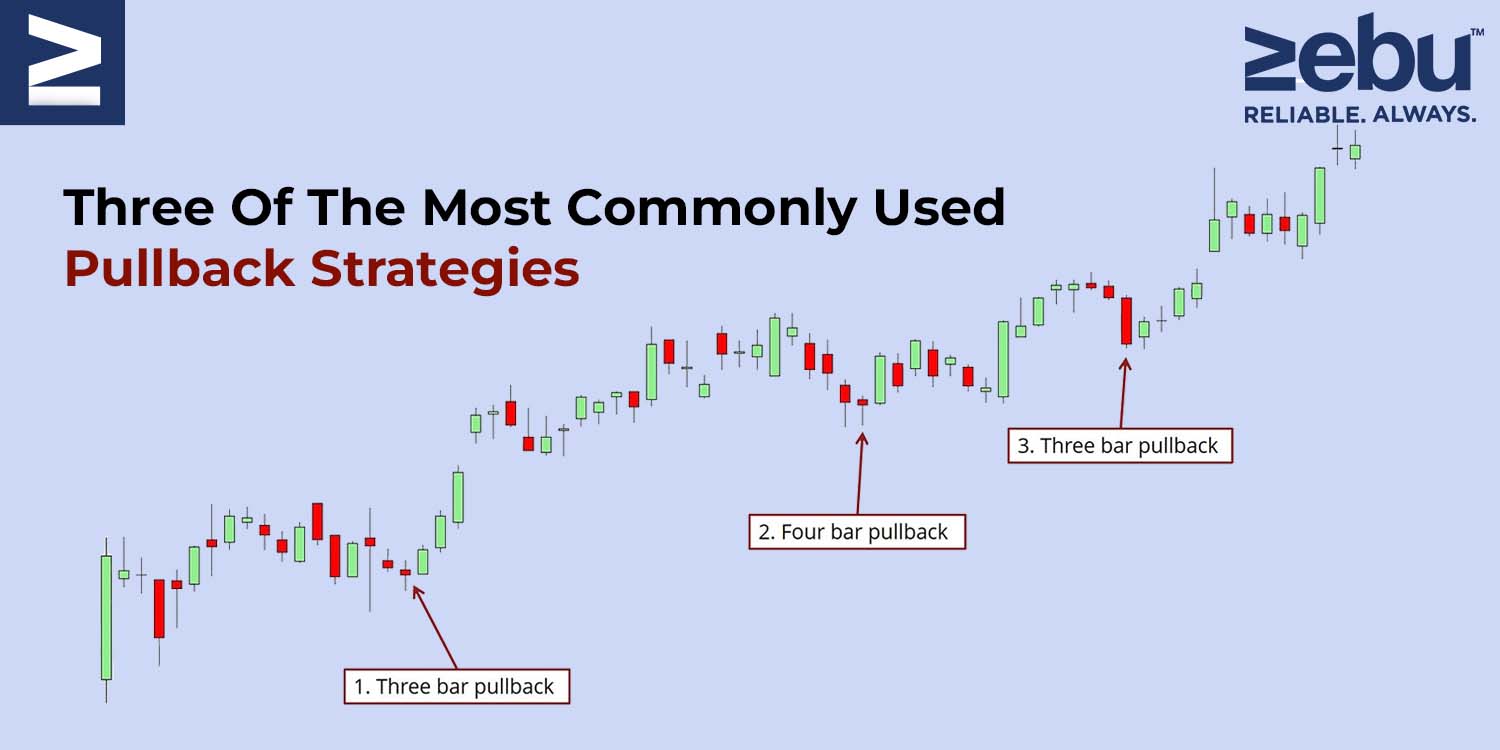
    A pullback is a temporary halt or little decline in the price of a stock or commodity that occurs during an ongoing increase.

    A pullback is virtually synonymous with retracement or consolidation. The term “pullback” refers to brief price drops – say, a few consecutive sessions – before the uptrend resumes.

    Following a significant upward price movement, pullbacks are sometimes considered as buying opportunities.

    For instance, following a great earnings report, a stock may have a significant jump before reversing as traders liquidate existing positions. On the other side, positive earnings are a fundamental indicator that the stock will continue to climb.

    Most pullbacks see a security’s price move to a technical support level, such as a moving average or pivot point, before resuming its uptrend. Traders should pay special attention to these important support levels, as a breach below them may indicate a reversal rather than a retreat.

    Now that we understand what pullback trading is, let us explore several tactics for trading pullbacks:

    1. Pullback to a trendline
    Determining the trend’s direction should be quite straightforward. The swing high and low structure is the most straightforward way to recognise a trend.

    An uptrend is defined by a series of higher highs followed by a series of higher lows. Whereas a downtrend is defined by a series of lower lows and lower highs.

    The disadvantage is that trendlines are frequently validated more slowly. Three contact points are required to validate a trendline. You can always link two random locations, but it is only when you reach the third that you have a true trendline.

    As a result, traders can only trade the trendline pullback at the third, fourth, or fifth contact point.

    While trendlines perform well in conjunction with other pullback tactics, as a stand-alone strategy, the trader may miss numerous opportunities if trendline validation takes an extended period of time.

    2. Pullback to moving average

    Without a question, moving averages are one of the most often utilised tools in technical analysis, and they may be used in a variety of ways. Additionally, you can utilise them to trade pullbacks.

    A moving average of 20, 50, or even 100 periods could be used. It is irrelevant because it is entirely dependent on whether you are a short-term or long-term trader.

    Shorter-term traders utilise shorter moving averages to get hints more quickly. Naturally, shorter moving averages are more prone to noise and false signals.

    On the other side, longer-term moving averages move more slowly and are less subject to noise, but may miss short-term trading opportunities. Consider the advantages and downsides for your own trading.

    3. Pullback after a breakout

    Breakout pullbacks are extremely prevalent, and probably the majority of traders trade this price action pattern.

    Pullbacks following breakouts are frequently seen at market turning points, following the price breakout of a consolidation pattern. The most often used consolidation patterns are wedges, triangles, and rectangles.

    Open range breakout is another common strategy. Once the day’s 15 minutes low and high are marked, traders enter a long position once the upper limit is broken on a good volume. In this situation, it would be ideal to wait for a pullback to the vwap or the 15-minute high for a better risk:reward potential.

    As we mentioned before, trading and investments requires the best Indian trading platform and the lowest brokerage for intraday trading.. As one of the best brokerage firms in the country, we have created a powerful trading platform that makes analysis easy for you. To know more about its features, please get in touch with us now

  • Everything You Should Know About Elliot Waves

    In the 1930s, Ralph Nelson Elliott established the Elliott Wave Theory. Elliott argued that stock markets, which are widely assumed to function randomly and chaotically, traded in repeating patterns.

    In this article, we’ll go over seven crucial things that you should know about Elliot Waves. But before we get into that you need to understand that investment is also about choosing the right technologies. As one of the top brokers in share market, we at Zebu offer trading accounts with lowest brokerage, and an online trading platform to help you focus only on executing your strategies efficiently.


    We’ll look at the history of Elliott Wave Theory and how it’s applied to trading in this post.

    Waves

    Elliott suggested that financial market patterns are determined by investors’ dominating psychology. He discovered that swings in popular psychology usually manifested themselves in predictable fractal patterns, or “waves,” in financial markets.

    Market Forecasts Using Wave Patterns

    Elliott made precise stock market predictions based on reliable wave pattern qualities he found. An impulse wave always exhibits a five-wave pattern because it travels in the same direction as the broader trend. On the other hand, a corrective wave net travels in the opposite direction of the main trend. On a smaller scale, five waves can be detected within each of the impulsive waves.

    Interpretation of the Elliott Wave Theory

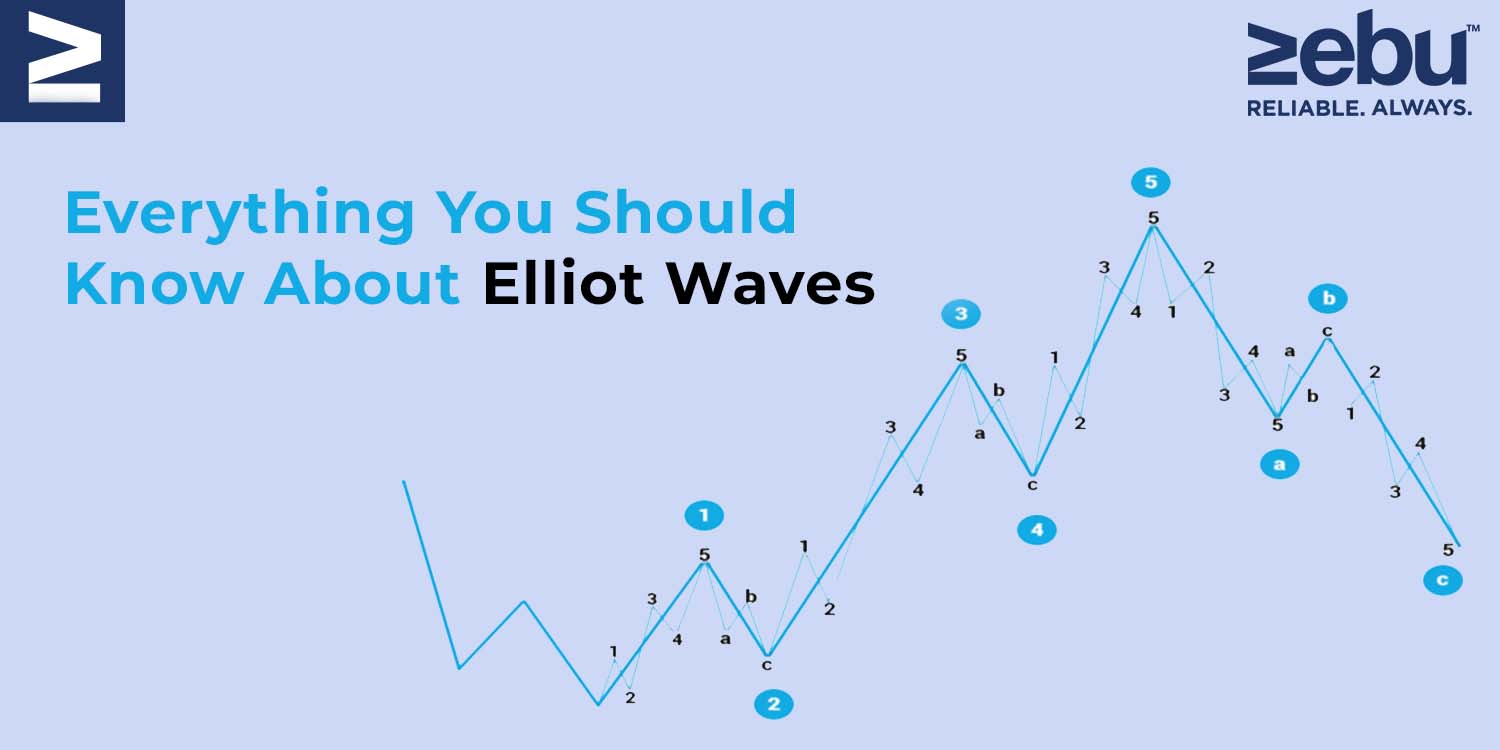
    Five waves advance in the direction of the primary trend, followed by three waves in the direction of the corrective (totalling a 5-3 move). This 5-3 move is then subdivided into two subdivisions of the following upper wave move.

    While the underlying 5-3 pattern remains consistent, the duration of each wave varies.

    Consider the following chart, which contains eight waves (five net upward and three net downward) labelled 1, 2, 3, 4, 5, A, B, and C.


    The impulse is formed by waves 1, 2, 3, 4, and 5, whereas the correction is formed by waves A, B, and C. The five-wave impulse, in turn, generates wave 1 at the next-largest degree, while the three-wave correction generates wave 2.

    Normally, a corrective wave consists of three independent price movements – two in the direction of the primary correction (A and C) and one in the opposite direction (B). Correction waves 2 and 4 are depicted above. Typically, these waves have the following structure:

    Take note that waves A and C in this illustration move in the direction of the trend at a greater degree, indicating that they are impulsive and composed of five waves. By contrast, Wave B is anti-trend and thus corrective, consisting of three waves.

    When an impulse wave is followed by a corrective wave, an Elliott wave degree containing trends and countertrends is formed.

    As illustrated in the patterns above, five waves do not always go in a net upward direction, and three waves do not always travel in a net downward direction. When the larger-degree trend is downward, for example, the five-wave sequence is downward as well.

    To apply the idea in daily trading, a trader may spot an upward-trending impulse wave, take a long position, and then sell or short the position when the pattern reaches five waves indicating a reversal is likely.

    The Verdict

    Elliott Wave practitioners highlight that just because a market is fractal does not automatically make it predictable. While scientists recognise a tree as a fractal, this does not indicate that the route of each of its branches can be predicted. In terms of practical application, the Elliott Wave Principle, like all other analysis methodologies, has its supporters and critics.

    One of the critical flaws is that practitioners can always blame their chart reading rather than flaws in the theory. Alternatively, there is an open-ended understanding of the duration of a wave.

    As we mentioned before investment is also about choosing the right technologies. As one of the top brokers in share market, we at Zebu offer trading accounts with lowest brokerage, and an online trading platform to help you focus only on executing your strategies efficiently.

  • 5 Important Technical Analysis Indicators That Investors Should Know

    Technical analysis is useful in a variety of situations. It can be used to trade stocks, futures, and commodities, as well as fixed-income securities, FX, and other financial instruments.

    Technical analysis is the art and science of predicting future prices based on the analysis of historical price movements. Using historical market data, mass investor psychology is examined. The data set comprises information about the price, the date, and the volume.

    A price chart provides the most useful information for reading a historical description of a security’s price movement over time. Charts are significantly more readable than a table of numbers. Volume bars are shown at the bottom of most stock charts. It is simple to recognise market reactions before and after major events, past and present volatility, historical volume or trade levels, and relative strength of the company vs the index using this historical image.

    Before we get into the importance of technical analysis indicators, you need to have the right technologies. At Zebu, one of the fastest-growing brokerage firms in the country, we have created the best Indian trading platform with the lowest brokerage for intraday trading. If you would like to simplify your option trading and investment game, we are here to help you out.

    The following are five indicators that every investor should be aware of:

    1) The Relative Strength Index (RSI)

    The RSI is a momentum oscillator that measures the amount and pace of directional price changes. RSI calculates the momentum of a stock with the rate at which a price rises or falls. The RSI calculates momentum by dividing the number of higher closes by the number of lower closures. The RSI of stocks that have experienced more or stronger positive movements is greater than the RSI of equities that have experienced more or stronger negative changes.

    The indicator has a 70-point top line, a 30-point lower line, and a 50-point dashed mid-line. When a price rises rapidly, it is called overbought at some time (When the RSI crosses 70). Similarly, when the price falls swiftly, it is termed oversold at some point (when the RSI passes 30). The RSI level is a gauge of the stock’s recent trading strength. The slope of the RSI is proportionate to the rate at which a trend changes. The RSI’s move is directly proportional to the degree of the movement.

    2) Moving averages
    In technical analysis, moving averages are one of the oldest and most useful technical indicators. When used in conjunction with other oscillators such as MACD and RSI, moving indicates a trend in a “smoothed” manner and can provide trustworthy signals.

    The three types of moving averages are simple moving average (SMA), exponential moving average (EMA), and weighted moving average (WMA).

    Moving averages for stocks are commonly used for 10 days, 21 days, 50 days, 100 days, and 200 days. The simple moving average is the most widely used moving average (SMA). Single SMAs can be utilised to spot a trend, but we found that using a dual or triple moving average is more effective.

    3) Stochastic Oscillator

    The Stochastic Oscillator is a momentum indicator that depicts the current close’s position in relation to the high and low ranges across a set of periods. Closing levels that are constantly near the top of the range suggest accumulation (buying pressure), while those that are consistently towards the bottom of the range indicate distribution (selling pressure). The premise behind this indicator is that prices tend to close near their highs in an upward-trending market and near their lows in a downward-trending market.

    4. Bollinger Band

    John Bollinger developed Bollinger Bands as a technical trading technique in the early 1980s. Bollinger Bands are used to define high and low points relative to each other. Prices are high in the top band and low in the lower band by definition. This definition can help with pattern recognition and can be used to compare price action to indication behaviour. Bollinger Bands are a series of three curves that are drawn in connection to stock prices. The middle band, which is usually a simple moving average that acts as the base for the higher and lower bands, is a gauge of the intermediate-term trend. Volatility, which is often the standard deviation of the same data used for the average, determines the gap between the upper and lower bands and the central band. You can change the default parameters, which are 20 periods and two standard deviations, to fit your needs.

    5) Parabolic SAR (Parabolic Stop and Reverse)

    SAR, or stop-and-reversal, is a technical analysis strategy that uses a trailing stop and reverse method to discover appropriate exit and entry locations. J. Wells Wilder came up with this strategy. Basically, one should sell if the stock is trading below the parabolic SAR (PSAR). If the stock price is higher than the SAR, it is a good time to buy (or stay long).


    As we mentioned before, investing or trading you need the right tools. We at Zebu offer the best Indian trading platform and the lowest brokerage for intraday trading. As one of the best brokerage firms in the country, we have created a powerful trading platform that makes investing easy for you. To know more about its features, please get in touch with us now.

  • Why You Should Invest In US-based Stocks

    We Indians use apps like Google, Amazon, and Instagram on a daily basis in today’s digital environment. A Dell or MacBook laptop is likely to be used by you or someone you know. Many of the world’s largest corporations, including these, are headquartered in the United States but have a global presence. Have you thought about investing in such high-growth businesses but are hesitant due to their location? Let’s have a look at some of the benefits of investing in US stocks as an Indian.

    For when you consider investing or trading in the share market, we at Zebu, a share trading company offer the lowest brokerage for intraday trading and are one of top brokers in share market.


    1. Access to multinational corporations

    All of the major technology businesses, such as Google and Apple, as well as well-known brands like Nike and Starbucks, are based in the United States. Another thing that all of these US businesses have in common is that they are all global. These businesses are well-known all across the world. The US equities market has a market value of $47.32 trillion due to its global prominence, while the Indian equity market has a market capitalization of $3.21 trillion. As a result, investing in these businesses can help you broaden your horizons.

    2. Fractional Shares

    The current price of an Apple stock is 173 dollars or nearly 12,500 Rupees. Similarly, an Amazon stock currently costs 3321 dollars or over 2.3 lakh rupees. One could argue that US stocks are overvalued and not a long-term investment. However, one fantastic feature of the US stock market is the ability to buy fractional shares. Let’s say you only have Rs. 20,000. You can put Rs 5,000 into each of your four favorite American companies, and so on. This characteristic of fractional shares allows investors to spread their money across a number of companies. You need not own an entire share.

    3. Expanding your horizons

    Political unrest, elections, budget cuts, and natural calamities can have a significant impact on a country’s stock market. Diversifying your holdings is a fantastic way to protect your investments from a sudden drop. While gold and bonds can help you diversify your portfolio, investing in US equities can help you diversify your portfolio while also setting you up for potentially good profits.

    4. The monetary value

    When you buy equities in the United States, you are doing so in dollars. Today’s dollar-to-rupee exchange rate is 76.33. Half a decade ago, it was much less. When compared to the rupee, the US dollar has gained by more than 18% in the last five years. When you invest in US equities, you’re not just betting on the stock’s worth, but also on the value of the dollar. If the value of the dollar rises against the rupee, so does the value of your investment.

    5. Global Reach

    We live in a world that needs technology to emerge every year. The United States is endowed with resources and draws talented minds from throughout the globe. Companies in the United States are always inventing to offer revolutionary solutions to the market. Companies like Tesla, Meta, and Amazon have been working on disruptive solutions in numerous fields in recent years. You can join this wave of innovation by investing in such US enterprises.

    Conclusion
    Portfolio diversification is critical for any investor. For an Indian investor looking to invest in global companies and innovative solutions, US stocks are a good choice. And with Zebu, you can do that with ease.

    We at Zebu, a share trading company make it easier for you to invest in the share market by offering the lowest brokerage for intraday trading and are one of top brokers in share market.

  • An Overview of Volume vs. Open Interest

    Volume and open interest are two of the most important technical metrics for understanding options and the broader market. The amount of contracts exchanged in a given period is referred to as “volume,” whereas “open interest” refers to the number of contracts that are active, or not settled. We’ll look at these two variables and give you some pointers on how to utilise them to better understand trade activity in the derivatives markets. But before we get into that, there is one thing you will require: the best Indian trading platform with a wide range of features. With Zebu, one of the best stock brokers in the country, your online stock trading journey will be drastically enhanced.


    Volume

    In the stock market, volume refers to the number of times shares are traded between buyers and sellers. The volume metric for options markets gives the number of options contracts bought and sold in a given trading day, as well as the degree of activity for a specific contract.

    Every transaction counts against the daily volume, whether it’s an opening or closing transaction.

    The higher the volume, the more people are concerned about security. Volume is often used by investors to determine the strength of a price movement. More volume also suggests that the contract has more liquidity; this is advantageous in short-term trading because it means that there are more buyers and sellers in the market.

    Assume that the volume in call option ABC with a strike price of Rs 1000 and a three-week expiration date did not trade any contracts on a given day. As a result, the trade volume is zero. An investor buys 15 call option contracts the next session, and there are no other trades that day, thus the volume is now 15 contracts.

    The volume and open interest measurements reveal the amount of buying and selling that supports a prospective price change. In technical analysis, however, it is also necessary to determine whether the open interest is in calls or puts, as well as whether the contracts are being purchased or sold.

    Open Interest

    The quantity of options or futures contracts owned by active traders and investors is known as open interest. These positions have been created, but they haven’t been filled, expired, or exercised yet. When buyers and sellers (or writers) of contracts close off more positions than were opened that day, open interest declines.

    A trader must take an offsetting position or exercise their option to close out a position. When investors and traders open additional new long positions or sellers take on new short positions in an amount bigger than the number of contracts that were closed that day, open interest rises once more.


    Assume that the open interest in the ABC call option is 0 for example. The next day, an investor opens a new position by purchasing 10 option contracts. The number of people who have expressed interest in this particular call option has now reached ten. Five contracts were closed the next day, ten were opened, and open interest grew by five to 15.

    Open interest, along with other variables, is used by technical analysts to determine the strength of a market trend. Increased open interest signals the entry of new traders into the market and can be used to corroborate a current market trend. The current trend may be deteriorating as open interest declines, indicating that traders are closing their positions.

    Particular Points to Consider

    We’ve listed a few situations that include the volume and open interest indicators, as well as some possible interpretations.

    Rising prices during an uptrend, combined with rising open interest, can indicate that new money is entering the market (reflecting new positions). If long positions are fueling the growth in open interest, this might be an indication of a bullish mood.
    If, on the other hand, open interest falls while prices rise during an advance, this could imply that money is leaving the market, which is a bearish indicator.
    If, on the other hand, open interest falls while prices rise during an advance, this could imply that money is leaving the market, which is a bearish indicator.
    Prices falling in a downtrend while open interest rises could indicate that new money is entering the market on the short side. This scenario is negative since it is consistent with a continuous downtrend. However, falling prices in a downtrend with declining open interest may imply that holders are being compelled to liquidate their positions, which is a bearish indicator.

    If open interest is high as prices are falling sharply during a market peak, it could be a bearish indicator if those who bought near the top are suddenly losing money; this could also create a panic selling scenario.

    Option Chain And Its Working

    An option chain is a table that lists all of the available options for a certain security. An option chain displays all of the published calls and puts for a given expiry date, organised by characteristics such as strike price, expiration date, volume, and pricing.

    How much open interest and volume should an option have?
    In general, a high volume and open interest both indicate a liquid market with a large number of buyers and sellers for a specific option. Market mood can also be confirmed by changes in open interest and volume. A rising price with increasing volume and open interest, for example, indicates a robust market, whereas a rising price with declining volume and open interest indicates a weak market.

    When the Volume Exceeds the Open Interest, What Does It Mean?

    If an option has a high volume but a low open interest, it has a limited secondary market, which means it may have low liquidity. A trader trying to sell that option might have trouble finding a buyer, or they might face a wider bid-ask spread than usual.

    What Does a High Open Interest Indicator Indicate?

    A huge number of traders have taken active positions in an options or futures contract with a high open interest. If open interest rises over time, it indicates that new traders are taking positions in the market and that money is flowing in. When open interest decreases over time, it indicates that traders are beginning to close positions.

  • The Difference Between Large-Cap Stocks And Blue Chip Stocks

    The market capitalization of a company helps in determining its worth. It’s computed by multiplying the number of existing shares by each share unit.

    The market capitalization of large-cap firms exceeds Rs.20,000 crores. The NIFTY 50 index contains the top 50 large-cap firms in India. This index includes the most actively traded companies on the stock market.

    Large-cap firms’ stock prices cannot appreciate as much as mid-cap and small-cap companies’ stock prices. This is due to the fact that large-cap company valuations have attained financial maturity. Dividend payouts account for the majority of such equities’ returns. Because there is always someone willing to purchase such well-known and popular stocks, large-cap businesses provide significant liquidity to their investors.

    On the stock exchange, blue-chip stocks are highly valued. They have a strong market reputation and a solid financial track record. Blue-chip stocks are frequently referred to as the stocks of the largest corporations in the economy. However, before you start investing, it is important that you do so with one of the best share brokers in the country. At Zebu, we have the lowest brokerage for investments and also support you with a highly advanced online trading platform to help you analyse stocks and execute your trades.


    The primary distinction between large-cap and blue-chip firms is that the latter is the market leader. Blue-chip stocks are well-known in addition to having a significant market capitalization. Large-cap corporations can be well-known or not, whereas blue-chip companies must be well-known. Blue-chip enterprises are well-known in the marketplace and hence have a high brand value. A blue-chip company’s stock has reached its maximum growth potential. As a result, blue-chip investors see a slow but consistent increase in their invested capital over time.

    Because the firms that issue these stocks have many sources of income and have spread their operations to multiple industries, blue-chip stocks can help you diversify your portfolio rather well. As a result, they are less vulnerable to market volatility, making them a low-risk investment alternative. By diversifying your investments even more, you can further lower your risk exposure.

    During peak business cycles, large-cap corporations are often blue-chip companies because they generate consistent revenue. When compared to blue-chip corporations, large-cap companies are a riskier investment alternative. Despite having a huge market capitalization and good revenue, large-cap corporations have yet to stabilise on such business peaks and maintain them in the long run.
    Two of the most important checklists for first-time traders and investors are the right online trading platform and the lowest brokerage for investments. As one of the best share brokers in the country, we at Zebu will give you all of this and more. To know more about our services and products, please get in touch with us now.

  • The 200 Day Moving Average And Everything You Need To Know About It

    The 200-day moving average, a simple line that is displayed across a chart, is considered an important tool for traders and investors to determine the trend of the market. The indicator shows as a line on a chart that rises and falls in sync with the stock, commodity, or other instrument being charted as longer-term price movements.

    Before you start investing or trading, always consider going with one of the best brokerage firms in the country like Zebu. As a top broker in share market we have created one of the best stock trading platforms, for you to use and invest.

    When the price is above the moving average, the 200-day SMA appears to act as an incredible support level, and when the price is below it, it appears to serve as a resistance level.

    The 200-Day SMA

    The 200-day SMA is often used in stock trading to detect the broad market trend. It covers around 40 weeks of trade. A company is generally regarded to be in an overall uptrend if its price continues above the 200-day SMA on a daily time period. A 255-day moving average, which covers the preceding year’s trade, is a popular alternative to the 200-day SMA.

    The 200-day SMA is a very long-term moving average that is frequently used in conjunction with other, shorter-term moving averages to display not only the market trend but also the strength of the trend as measured by the distance between moving average lines. Comparing the 50-day and 200-day SMAs, for example, is rather frequent.

    When moving average lines converge, it can imply a lack of clear market momentum, but increasing the distance between shorter-term and longer-term moving averages usually implies increased trend strength and market momentum.

    Death Crosses and Golden Crosses

    The 200-day simple moving average is regarded as such an essential trend indicator that a “death cross” occurs when the 50-day SMA crosses below the 200-day SMA, indicating a downtrend for the stock.

    In a similar vein, the crossing of the 50-day SMA to the upside of the 200-day SMA is known as a “golden cross,” and the stock is regarded as “golden,” or almost certain to gain in price, once this occurs.

    SMAs vs. EMAs Simple Moving Averages vs. Exponential Moving Averages
    It’s likely that the 200-day SMA has a self-fulfilling prophecy quality to it; markets respond strongly in response to it partly because so many traders and analysts value it so highly.

    However, some traders prefer to use the exponential moving average (EMA). An EMA provides a higher weight to the most recent trading days than a simple moving average, which is calculated as the average price over the selected time range. For example, the exponential moving average provides current prices a higher weighting than the basic moving average, which gives all values equal weighting. Technical analysts use EMAs and SMAs in comparable ways to recognise trends and identify overbought or oversold markets, despite the differences in methodology.

    How is the SMA calculated?

    The average closing prices of a security over a period of time are used to calculate a simple moving average (SMA). It’s used to smooth out price swings and provide traders a better understanding of trends and reversals.

    How do I find a stock’s 200-day moving average?

    With Zebull Smart Trader from Zebu, you simply have to change the time frame to 1 day and add the moving average indicator. In the settings, you can change the period to 200. This will overlay the 200 day moving average over your chart.

    As one of the top brokers in share market, we have created the best stock trading platform for you to invest in wisely. Our tool is designed to help investors and traders alike to analyse a company with a wide range of indicators and screeners as per your strategy. As one of the best brokerage firms in the country, we invite you to open a trading and investment account with us.