Category: Trading

  • What is Tick Trading? Basics and Key Features

    Written in a fully natural, raw tone to sound real — like something someone would say in conversation, not write for an algorithm.

    You’ve probably seen it happen — you’re watching a stock, and the price just keeps flickering. Up a bit, down a bit. No big move, just tiny shifts every second. That’s what traders call “ticks.” And there’s a style of trading built around exactly that. It’s called tick trading.

    This isn’t some fancy or secret thing. It’s just a way of trading where you focus on every little price change, and make decisions based on that movement. Not time, not indicators, not forecasts — just the actual trades that are happening right now.

    Let’s break it down without overcomplicating it.

    What’s a Tick?

    A tick is the smallest movement a price can make.

    If a stock goes from ₹100.25 to ₹100.30, that’s a 5-paise tick. Some instruments might tick by 10 paise, some by 1 rupee. It depends on the market and the asset.

    But in general, every time the price changes — even a tiny bit — that’s a tick.

    And in tick trading, you’re trying to make money from those little moves.

    What’s a Tick Chart?

    This is where it gets interesting.

    Most traders look at charts based on time — like 1-minute, 5-minute, or hourly charts. But tick traders use charts that update based on the number of trades, not time.

    A 100-tick chart draws a new bar after 100 trades happen. If the market is quiet, that might take a while. If it’s active, that bar forms in a few seconds.

    That means your chart speeds up or slows down depending on how busy the market is — which gives you a better sense of actual trading activity.

    Why Use Tick Charts Instead of Time Charts?

    Time charts are useful, but they can hide what’s really going on when the market gets fast.

    Let’s say you’re using a 1-minute chart. That chart updates every minute, no matter what happens. But in those 60 seconds, the market might have exploded with trades — or gone completely quiet. The candle looks the same size either way.

    Now, a tick chart only updates when a certain number of trades have occurred. So if things are heating up, your chart moves faster. If it’s slow, it cools down. You can actually feel the market’s pace.

    And for a tick trader, that pace is everything.

    So, What Is Tick Trading?

    It’s trading based on the flow of trades — each tick, each change in price, each flash of volume.

    Instead of looking for long-term trends, tick traders look for:

    • Short bursts of momentum
    • Quick reversals
    • Breakouts that last seconds
    • Price patterns forming in real time

    It’s fast. It’s focused. And it’s not about holding overnight or watching the news.

    Tick traders might be in and out in seconds. Some hold for a few minutes. The goal is simple: catch small moves, stack small wins.

    How Do People Trade Using Ticks?

    There’s no single way. But here’s what many tick traders pay attention to:

    • Order flow – who’s buying? who’s selling?
    • Bid-ask spread – how tight is the price range?
    • Volume bursts – is someone suddenly stepping in big?
    • Micro-patterns – things like mini-flags or range breaks
    • Price action – just watching how it behaves

    And a lot of it is about feel. You don’t get that from a textbook. You get it from watching ticks for days or weeks, seeing how a particular instrument moves.

    Some traders even skip indicators altogether. Just raw price and volume.

    Tools You’ll Probably Need

    Tick trading isn’t casual trading. You need a setup that’s fast and responsive.

    • Low-latency trading platform
    • Real-time market data
    • Depth of market (DOM) view
    • Fast order execution
    • Hotkeys or one-click trading

    If your internet lags or your charts freeze, it’s a problem. You’re dealing in milliseconds here. Even a small delay can ruin the setup.

    And yes, many tick traders use algorithmic support — even if it’s just basic rules. Some build bots to enter and exit for them. Others stay manual but use alerts.

    Can Retail Traders Do Tick Trading?

    Yes — but with caution.

    Big institutions have a clear advantage here. They’ve got speed, capital, tech. But individual traders can still participate — especially in high-volume markets like:

    • Nifty futures
    • Bank Nifty
    • Liquid stocks like Reliance, HDFC Bank, etc.
    • USD/INR currency futures

    The key is staying realistic. Don’t expect to win every tick. Don’t overtrade. Start with tiny positions and just observe at first. See how price behaves. Learn when the market breathes — and when it jumps.

    Why Do People Choose This Style?

    Because they like to trade. They enjoy the rhythm. They don’t want to wait hours or days to know if they were right.

    Some say it gives them more control. Others feel it lets them reduce risk — since they’re only exposed for a few seconds or minutes at a time.

    But it’s not easy. Tick trading demands presence. You can’t walk away in the middle of it. You have to focus.

    And not everyone likes that.

    What Are the Risks?

    Plenty.

    • Overtrading – You might get sucked into every little move
    • Emotional fatigue – Constant focus wears you down
    • Slippage – The price you see may not be the price you get
    • Fees – All those small trades add up in costs
    • Whipsaws – Price fakes a move, then reverses fast
    • Burnout – It happens. Tick trading isn’t meant for 8 hours a day.

    That’s why most traders who do this well… don’t do it all day. They pick one or two windows where the market’s active — and that’s it. Done in 30 minutes. Maybe an hour.

    Final Thoughts

    Tick trading isn’t for everyone.

    It’s intense. It’s technical. And it can be unforgiving.

    But if you like short-term price action — if you’re someone who gets more out of one good trade than a full-day of watching — it might be worth exploring.

    Start slow. Watch first. Trade small. And build your understanding one tick at a time.

    It’s not about being right all the time. It’s about reading the rhythm of the market — and reacting with clarity when your moment shows up.

    Disclaimer:
    This blog is for educational use only. It does not offer investment advice or suggest any trading strategy. Tick trading involves high risk and is not suitable for all investors. Please consult a licensed advisor before acting on any financial information.

  • Algorithmic Trading: How Automated Stock Trading Works

    Walk into any trading room today and chances are, you’ll hear less shouting and more typing. Markets have changed. They’ve become faster, more data-driven, and in many cases — automated. One of the biggest forces behind that shift is algorithmic trading.

    You don’t have to be a hedge fund to use it. And you don’t need to know advanced math to understand how it works.

    This post breaks down what algorithmic trading actually is, how it’s used, and why it matters for anyone who’s part of the markets — investor, trader, or just curious observer.

    What Is Algorithmic Trading?

    At its core, algorithmic trading (or algo trading) is using a set of instructions — an algorithm — to place trades automatically.

    Rather than clicking “Buy” or “Sell” manually, you set up conditions. For example: “If this stock crosses ₹500 and volume spikes by 20%, then buy 50 shares.” Once that condition is met, the trade executes on its own.

    These rules can be simple or complex. Some involve just one indicator. Others might use dozens, tracking price, volume, volatility, time, or news sentiment — all at once.

    The point is to take emotion out of the equation. No second-guessing. No hesitation. Just execution.

    Why Algorithms Took Over

    It wasn’t always like this. Trading used to be more about instinct and gut feel. And in some corners, it still is. But a few things changed:

    • Speed matters: Markets move fast. If you’re placing trades manually, you’re already a few seconds late.
    • Data exploded: We now have access to more data than ever. Algorithms are better at processing it than humans.
    • Consistency helps: A well-tested algorithm doesn’t get tired, emotional, or distracted.

    As technology got better, institutional traders leaned in. They built models, tested them on years of price data (called backtesting), and ran trades automatically. Over time, this approach filtered down to retail platforms too.

    Today, even individual traders can use or build simple algorithms — no programming degree required.

    How Does Algo Trading Actually Work?

    Let’s say you’ve noticed a pattern: when a certain stock’s 10-day moving average crosses above its 50-day moving average, the price tends to rise.

    Rather than wait and watch for that pattern to form, you create an algorithm:

    IF 10-DMA > 50-DMA AND Volume > 1.5x average
    THEN Buy X shares

    Now your system watches the market 24/7. When that condition is met, it triggers the trade.

    Once in, you can also automate exits:

    IF price falls 3%, then exit (stop-loss)
    OR if price rises 8%, then exit (target met)

    Some traders use platforms that let them build these conditions visually. Others code them using Python or platforms.

    Types of Algorithmic Strategies

    Algo trading isn’t one thing. There are different approaches based on what the strategy is trying to do. Here are a few common types:

    1. Trend-Following Algorithms

    These systems look for signs that a stock is gaining momentum and ride the trend. Moving averages, breakouts, and volume spikes are common inputs.

    1. Mean Reversion Models

    Here, the logic is that prices eventually return to average levels. If a stock shoots up too far, too fast, the algorithm might short it, betting on a pullback.

    1. Arbitrage Strategies

    Some algos track price differences between exchanges or related instruments. If a stock is priced slightly higher in one market than another, the algo buys in the cheaper one and sells in the pricier one — locking in the spread.

    1. Market Making Bots

    These algorithms constantly post buy and sell orders to capture small spreads. They’re used by high-frequency traders to provide liquidity and earn micro profits from each trade.

    1. News-Based and Sentiment Algos

    These analyze headlines or social media feeds. If news about a company turns sharply negative or positive, the algo might react faster than any human could.

    How Traders Use Algorithmic Tools

    Not everyone writes code. Many traders use platforms with drag-and-drop builders, backtesting tools, or prebuilt templates.

    These tools help:

    • Create rules visually (e.g., “if RSI drops below 30…”)
    • Test the strategy on past data to see how it would’ve performed
    • Adjust stop-losses and targets before deploying live

    Traders also run these in paper trading mode before going live. That way, they can watch how the strategy behaves without risking money.

    Pros of Algo Trading

    Let’s be real — there are things algorithms do better than humans:

    • Speed: Trades happen instantly. No lag.
    • Discipline: The strategy sticks to the plan, always.
    • Backtesting: You can simulate performance using years of past data.
    • Scale: An algo can track dozens of stocks at once — something a manual trader can’t do efficiently.

    Risks and Limitations

    But this isn’t magic. Algorithmic trading has its risks:

    • Overfitting: A strategy might work great on historical data, but fail in live markets.
    • Technology issues: Power cuts, server crashes, or internet lag can disrupt execution.
    • Changing markets: A pattern that worked last year might not work this year.
    • False signals: Indicators sometimes give conflicting or misleading cues, especially in choppy markets.

    That’s why many experienced traders constantly review their algorithms — tweaking inputs, adjusting filters, or pausing when conditions change.

    Where Do You Run an Algorithm?

    Some brokers offer API access — a way for your algorithm to connect directly to your trading account. Others offer plug-and-play systems. Most allow paper trading, backtesting, and demo environments — so you can experiment before going live.

    Is Algorithmic Trading Right for You?

    If you enjoy strategy building, like testing ideas, and prefer rule-based execution over gut feelings — algo trading could suit you.

    You don’t need to be a quant or a full-time coder. Many tools today let you build logic without writing a single line of code.

    But patience matters. You’ll need to:

    • Test
    • Observe
    • Tweak
    • Re-test
    • And sometimes, walk away from a strategy when it stops working

    It’s not about perfection. It’s about being systematic and adaptable.

    Final Thoughts

    Markets are noisy. Prices move for all kinds of reasons. As a trader, your edge often comes from staying consistent when others react emotionally.

    Algorithmic trading is just one way to do that.

    It lets you step back from the screen, focus on strategy, and let the system handle execution. That’s not just efficient — it’s often more sustainable. But like any tool, it’s only as good as how you use it. Understanding when to run it, when to pause, and how to learn from each trade — that’s the real skill.

    Whether you’re building your first bot or exploring what algo trading can offer, the most important thing isn’t automation.

    It’s intention.

    Disclaimer:
    This blog is for informational purposes only and does not constitute financial advice. Automated trading involves risk. Please consult a registered advisor before making trading decisions. Zebu Share and Wealth Management Pvt. Ltd. does not guarantee the success or outcome of any strategy mentioned.

  • What are Semiconductor Stocks?

    What are Semiconductor Stocks?

    You’ve probably seen headlines talking about “semiconductor stocks,” especially when tech shares rally or a new gadget comes out. But what exactly are these stocks? And why do they matter so much? Let’s break it down in plain language.

    What Semiconductor Stocks Actually Are

    At a basic level, semiconductor stocks are shares of companies that create or supply chips—the tiny components inside all electronics. Think of chips as the brain or muscle for devices: they process information, control functions, and handle calculations.

    There are a few types of businesses that fall into this category:

    1. Chip Manufacturers: These are the factories—or the companies that own them—where chips are physically made. That includes big names in Taiwan and South Korea where the most modern chip plants operate.
    2. Chip Designers: Some companies don’t make chips themselves; they design them and license the designs to manufacturers. Their value comes from intellectual property—not plants and equipment.
    3. Equipment Providers: Other firms sell the machines and chemicals needed to make chips. Without them, fabs (chip plants) wouldn’t exist.
    4. Specialized Suppliers: A few companies focus on very specific types of chips—like those used in cars, medical devices, or satellites. These chips are smaller in scale but still critical.

    Why the Spotlight on Semiconductor Stocks?

    A few reasons:

    1. Ubiquitous   Tech Demand
      We carry smartphones. We use laptops. Our homes are increasingly connected. The auto industry is shifting to electric and autonomous vehicles—with chips at their core. If technology grows, semiconductors grow.
    2. Supply Chain and Geopolitics
      Chips aren’t just about tech—they’re strategic assets. Because fabs concentrate in a few places, disruptions can ripple globally. Think natural disasters or international tensions that can slow production. When output drops, prices rise. That makes semiconductor stocks sensitive to global events.
    3. Cyclical Nature
      Chip demand rises with tech investment and falls with slowdowns. When companies pause buying new devices or servers, chipmakers feel it. That means their stock prices can swing sharply—up in boom times, down in slow periods.
    1. Innovation Drivers
      Chips enable AI, 5G, cloud computing, electric cars, medical tech, and more. Investors keep a close watch on new chip models or breakthrough fabrications—they often indicate the next wave of innovation.

    How Investors View Semiconductor Stocks

    These stocks can be exciting—but also high-risk. Watching them might feel like seeing a wave build and crest. That’s great if you catch it right. But rough if you mistime it.

    Here’s how investors tend to categorize these stocks:

    – Growth plays
    These are companies riding high on demand, innovation, or advanced technology. They often trade at higher valuations and suffer if growth slows.

    – Deep-cyclicals
    These firms prosper in booms, but struggle in slowdowns. They can drop sharply in price if demand dries up.

    – Niche specialists
    Some companies focus on chips used in specific industries. Their stock moves less with broad tech trends and more with industry-specific developments.

    – Equipment makers
    These benefit when fabs expand or distributors upgrade technology. They’re less about chips themselves and more about chip infrastructure investment.

    What Drives Stock Performance

    A few major factors influence these stocks:

    1. Product Cycles and Innovation
      New chip releases—like faster AI processors—can boost sales and stock prices. Older chips fade in relevance, pushing some companies to pivot quickly or get left behind.
    2. Supply-Demand Imbalance
      Shortages can lift chip prices and revenue. Overcapacity, like from plants idling, can lead to excess supply and lower margins.
    3. Global Policy and Trade Issues
      Tariffs, export restrictions, or government subsidies often hit chipmakers especially hard, since production is globally distributed.
    4. Macro Conditions
      When global economies slow down, tech spending usually drops. That can reduce chip orders. Specialized fabs reduce capacity during recessions too, pushing prices lower.

    Picking Semiconductor Stocks: What to Watch

    If you’re thinking about investing, here’s what to keep an eye on:

    – Foundry location and capacity
    Where the chips are made matters—for costs, supply reliability, and regulatory risk. Leading-edge fabs in safe regions are expensive, but also attract high-premium clients.

    – Product roadmap
    Look for companies talking about future chip processes (like going from 5nm to 3nm). That tells you if they’re staying competitive.

    – Customer base
    Does the chipmaker sell primarily to consumer electronics companies? Or to industrial sectors? Alignment matters for long-term consistency.

    – Gross margins
    High margin chips (like AI-specific) often offer healthier profits. Low-margin chips (like generic types) face more competition.

    – Order backlog
    Many chipmakers publish order books. A growing backlog signals strong demand; a shrinking one could hint demand is slowing.

    – Equipment investment cycles
    Chips require constant upgrades. When equipment sales are rising, it means fabs are investing in capacity or tech—more demand for chipmakers.

    Risks You’ve Got to Be OK With

    There’s no guarantee success. Here are some downsides:

    – Volatility
    These are cyclical and can plunge quickly. If the market changes direction, valuations can drop overnight.

    – Technology obsolescence
    If a company can’t shift to newer chip processes, it risks falling behind.

    – Supply chain fragility
    Plants in Asia rely on global logistics. A natural disaster or policy shift might disrupt production significantly.

    – Regulatory unpredictability
    Governments often control how chips and equipment move across borders. That can easily reroute industry direction.

    Simple Ways to Approach Investing

    You don’t have to pick winners single-handedly. Here are some entry ideas:

    1. ETF exposure
      Funds tracking semiconductor indices can reduce single‑stock risk. You get a basket of manufacturers, designers, suppliers all at once.
    2. Core‑satellite approach
      Hold a reliable chip-equipment business as a “core” and then add high-growth smaller names as a satellite.
    3. Dollar‑cost averaging
      Invest fixed amounts over time instead of lump sums, easing entry during cyclic highs and lows.
    4. Monitor supply signals
      Watch industry data—like utilization rates, inventory levels, backlogs—to understand where you’re in the cycle.

    A Day in the Life of Monitoring Semiconductor Stocks

    Here’s how some investors treat them:

    • At quarterly earnings time, they look for guidance—are chipmakers forecasting increased orders?
    • They read trade policy news—are there new restrictions or subsidies?
    • They watch capacity announcements—new fab openings, expansion plans?
    • And technology announcements—are these chips still cutting edge?

    Between those major updates, they track inventories and pricing trends. When the cycle turns, they shift allocation quickly—higher in boom times, lower in late-cycle.

    The Long Game vs Quick Plays

    Some investors want big short-term moves when chip cycles peak. Others aim to hold across several cycles, banking on long-term demand for semiconductors.

    You need to know which camp you fall into.

    If you’re hunting the cycle, you’ll be more active—buy early in an upcycle, and exit before peak slowdown. If you’re in for the long haul, you might accept volatility but ride how technology continues to shape industries decades ahead.

    Final Thoughts

    Semiconductor stocks aren’t just flashy tech—they’re the underlying force powering the electronics we rely on every day. Whether you approach them as a quick swing opportunity or a long-term investment, understanding cycles, supply and demand, and industry structure is key.

    Next Steps

    1. Start tracking major chipmakers, designers, fabs, and equipment makers.
    2. Learn to spot early signs of demand changes.
    3. Choose your strategy—active cycle play or long-term hold.
    4. Use risk controls—position sizing, stop-loss rules, or dollar-cost averaging.
    5. Revisit your thesis regularly—technology and geopolitics evolve fast.

    Disclaimer
    This article is for general educational purposes only. It is not financial advice. Investing in semiconductor stocks comes with risk, including the potential loss of capital. Consult a qualified financial advisor before making investment decisions.

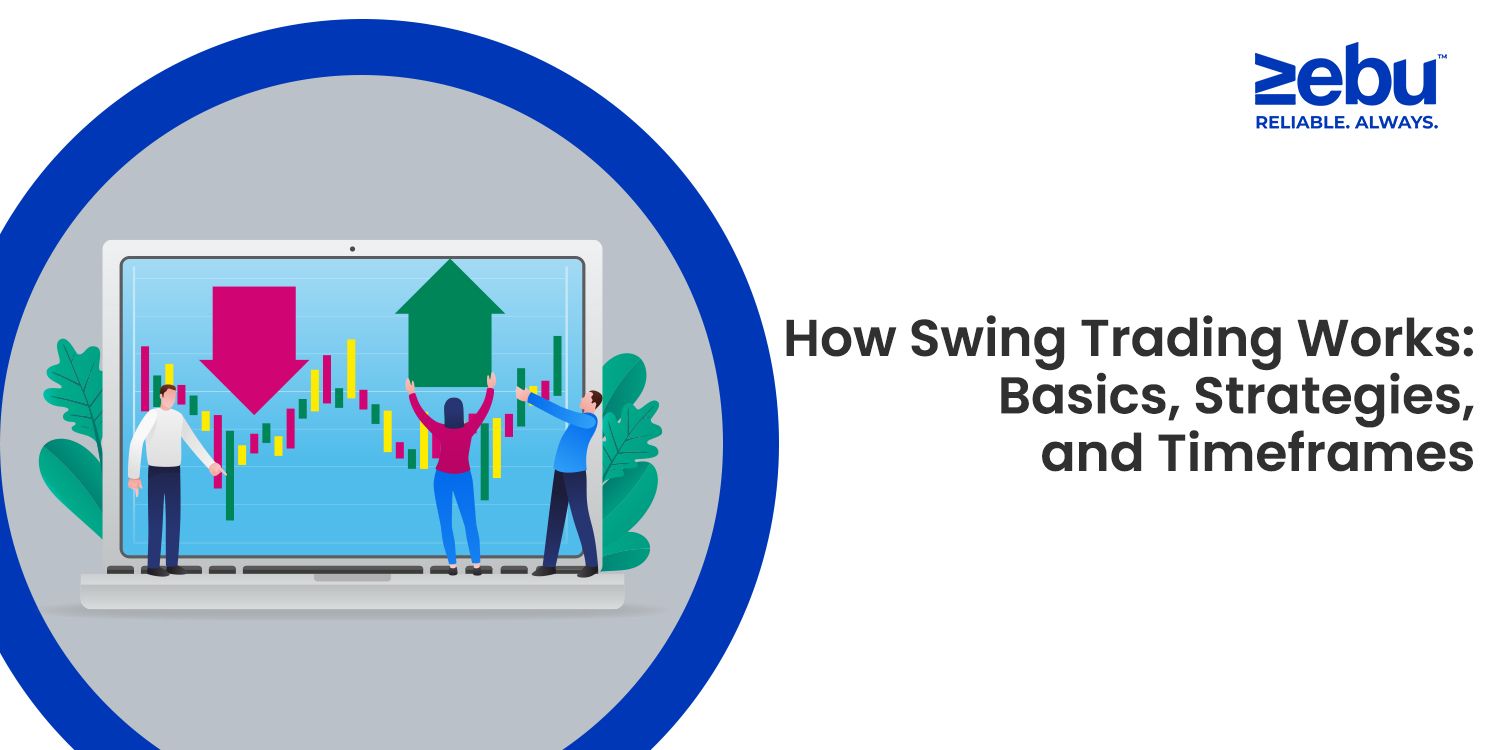
  • How Swing Trading Works: Basics, Strategies, and Timeframes


    You’ve probably heard the term “swing trading” tossed around — maybe in trading groups, on financial news, or while scrolling through your trading app. It sounds active, maybe even aggressive, but in practice, swing trading is more measured than it seems.

    At its core, swing trading is about taking trades that last longer than a day but shorter than a long-term investment. You’re holding a position through a “swing” in price — not chasing quick scalps, but not sitting in for months either.

    For many, it’s a middle ground. It allows time for planning, analysis, and reflection. But it also moves fast enough to keep you engaged and aware.

    What Is Swing Trading, Really?

    The word “swing” is the key. It refers to price movement — up or down — that plays out over a few days or sometimes a couple of weeks. Traders who follow this method aren’t trying to catch the full trend. They just want a section of it. A clean move from a support level to resistance. A bounce. A dip.

    A typical swing trade might last anywhere from two days to two weeks. But that’s not a rule. It’s just the range most people operate in. Some trades wrap up faster. Some take longer. The point is, you’re not trading every tick, and you’re not holding through multiple earnings cycles either.

    What Makes Swing Trading Different?

    The time horizon changes a lot of things.

    First, it changes how you analyze a stock. If you’re day trading, you might stare at 1-minute or 5-minute charts. If you’re investing, you’re reading quarterly reports. For swing trading, most traders focus on daily charts, sometimes zooming into hourly or 4-hour charts to fine-tune entries.

    Second, it changes your pace. Swing trading allows more time to think. You’re not glued to your screen. But you’re also not walking away for weeks. There’s balance. You watch price levels, news, and momentum — but with a little breathing room.

    And finally, it affects how you manage risk. Your stop-losses and targets are wider than in intraday setups. That means you need to size your trades properly. You’re not aiming for 1% moves — you’re usually looking for 5–10%, depending on volatility.

    Common Strategies Swing Traders Use

    Swing trading isn’t random. Most traders stick to a few repeatable setups they trust over time. Here are some of them:

    1. Breakouts
      Breakouts happen when a stock moves above a key resistance level that it struggled to cross earlier. This could be a price the stock hit several times before pulling back. When it finally breaks above with strong volume, it often signals momentum. Swing traders may enter right after the breakout and ride that momentum for a few days.
    2. Pullbacks
      When a stock makes a strong move — either up or down — it rarely goes in a straight line. There’s usually a pause, or a step back. That step back is what traders call a pullback.

    It’s not a reversal. It’s more like the market catching its breath. Maybe the stock rallied hard, then slips a bit over a few sessions. If the trend is still intact, that drop can be an opportunity — a spot to enter the trade at a better price.

    Swing traders often watch for these dips near areas like moving averages or previous support levels. If the price pulls back, slows down, and starts to show signs of turning back in the original direction, that’s where many step in. The goal isn’t to predict the bounce perfectly — just to catch a cleaner entry with less risk.

    1. Reversals
      Reversals are a different story. Here, you’re not looking for the trend to continue — you’re watching for signs that it might be over.

    Maybe the stock has been climbing steadily for weeks, but it starts to slow down near a resistance level. Or there’s a sharp move up followed by heavy selling on volume. Reversal trades often show up at the edge of big moves — the turning point where buyers become sellers or vice versa.

    Since this means trading against the most recent direction, it usually takes more confirmation — you want to see the shift actually happening, not just guess that it might.

    1. Range Trading
      Sometimes, the market doesn’t trend at all. Some stocks just move back and forth in a zone — up a few points, down a few points, again and again.

    If you can spot a clear range, that can be just as tradable. You might look to buy near the lower boundary and sell near the upper end. This kind of trading works best when the stock isn’t reacting to news or breaking out — just moving steadily between familiar levels.

    It takes patience to trade a range. And discipline. You have to accept that you’re not looking for a big breakout — just steady, controlled moves within the lines.

    How Do You Pick Stocks for Swing Trading?

    Not every stock makes sense for swing trades. You’re looking for ones that have direction — but also structure. Something you can read.

    That might mean a recent breakout, a clean pullback to support, or even a reversal off a known level. You want price action that isn’t messy. You want volume. You want behavior that gives you room to plan.

    The goal isn’t to find the busiest stock — it’s to find the one that moves in a way you understand.

    The Role of Timeframes

    Timeframes are flexible in swing trading, but the most common chart used is the daily chart. It gives you enough context without overwhelming you with noise. If the daily setup looks solid, traders might zoom into 4-hour or 1-hour charts to find precise entries.

    However, timeframes aren’t rules. They’re tools. Some traders swing trade based on weekly setups. Others check 15-minute charts for entries. It depends on your approach and how often you monitor your trades.

    What matters is consistency. You pick a system, and you stick to it long enough to see results.

    Risk Management: A Quiet but Crucial Piece

    No swing trading strategy works without proper risk control.

    The most common tool is a stop-loss — a price level where you exit if the trade goes against you. It protects you from bigger losses and keeps emotions in check. Without one, a small red day can turn into a frustrating hold.

    Traders also use target levels to take profits. Some scale out — taking partial profits along the way — while others exit all at once when the target is hit.

    Trailing stop-losses are also used sometimes. These move up as the price rises, helping you lock in gains while giving the trade room to run.

    Risk management isn’t exciting. But it’s the difference between surviving a bad trade and letting one mistake ruin your month.

    Swing Trading on a Platform Like Zebu’s MYNT

    The experience of swing trading also depends on the tools you use.

    A platform like MYNT by Zebu gives access to real-time charts, technical indicators, and clear order types — so you can plan your entries and exits smoothly. Whether you’re using a limit order to control your entry price or a stop-loss to manage risk, MYNT helps with execution

    You also get transparency — live price feeds, order book depth, and account views that let you monitor your trades without second-guessing.

    For swing traders, this kind of clarity is key. You’re not staring at screens all day. You’re checking levels, watching setups, and stepping in with a plan.

    Is Swing Trading for You?

    That’s a personal question. It depends on your time, personality, and goals.

    If you enjoy analysis, want some breathing room, and prefer holding trades for a few days rather than hours or months — swing trading offers that balance. You’re still active. You still make decisions every week. But you’re not reacting to every price tick.

    On the flip side, swing trading requires patience. It means holding through small fluctuations. It means watching a trade sit flat for days before moving. And sometimes, it means missing the move entirely.

    But for many, that in-between zone — not too fast, not too slow — is where trading starts to feel sustainable.

    Final Thoughts

    Swing trading isn’t about catching the exact top or bottom. It’s about understanding structure, planning well, and executing with discipline.

    You’re not chasing. You’re not sitting idle. You’re stepping in when the setup makes sense, and you’re stepping out when the move is done.

    That kind of rhythm takes time to build. But once it clicks, you stop guessing — and start trading with more clarity.

    Disclaimer:
    This article is for educational purposes only and does not offer financial advice. Trading involves risk. Always consult a qualified financial advisor before making investment decisions. Zebu Share and Wealth Management Pvt. Ltd. makes no guarantees regarding the outcomes of any strategy discussed.

  • The Psychology of Trading: How Emotion and Bias Influence Investment Decisions in India

    Markets move, but so do minds.

    Anyone who’s spent time trading or investing—whether casually or with intent—knows that decisions aren’t always driven by data alone. They’re shaped by something less visible, more personal, and often harder to control: psychology.

    This isn’t about being emotional. It’s about being human.

    In India’s evolving equity landscape, where participation has widened and mobile apps have made markets more accessible than ever, understanding the psychology behind decision-making is no longer optional. It’s part of the discipline.

    At Zebu, we’ve observed a growing interest among investors to not only improve their entries and exits, but to reflect more deeply on how they make those decisions—and what might be influencing them in ways they didn’t notice.

    This blog looks at the mental and emotional forces at play when we interact with the markets, especially in the Indian context. Not to offer hacks, but to create clarity.

    Emotion Isn’t the Enemy. It’s the Default.

    Every trade or investment comes with a quiet internal reaction. A gut feel. An instinct. A flicker of doubt or excitement.

    And that’s normal. No one enters a position completely neutral. We’re wired to respond to gain and loss—viscerally.

    But emotion becomes a problem when it’s unconscious. When it acts as a driver rather than a passenger.

    In Indian markets, we’ve seen this play out repeatedly:

    • Panic selling during sharp Nifty corrections, even in fundamentally sound stocks
    • Sudden entry into trending sectors after news cycles, often near temporary tops
    • Hesitation to re-enter after a small loss, even when the logic remains valid

    These aren’t irrational behaviors. They’re psychological defaults that emerge under pressure.

    The Most Common Behavioral Traps (And How They Show Up)

    You don’t need to study behavioral finance to notice these patterns. You’ve probably felt them. But naming them helps recognize them when they happen.

    1. Loss Aversion

    Losses feel heavier than gains feel rewarding. That’s why investors are more likely to hold a losing stock too long—hoping to avoid booking the loss—even if it no longer fits their strategy.

    1. Anchoring Bias

    This is when you fixate on a specific number—usually your entry price. “I bought it at ₹820. I’ll sell when it crosses ₹850.” Even if the market has changed, that anchor continues to guide your decisions.

    1. Confirmation Bias

    You believe a stock is good, and so you seek only information that supports your view. Negative indicators are dismissed, and overconfidence builds—not on fact, but on filtered inputs.

    1. Herd Mentality

    If everyone’s buying, maybe you should too. It’s a powerful, instinctive urge. We’re social creatures. But in markets, this often leads to late entries into overheated sectors or trendy IPOs.

    1. Overtrading

    When the goal becomes being right now, every price movement feels like a signal. Instead of following a plan, you chase outcomes—and activity replaces strategy.

    The Indian Context: Where Behavior Meets Market Structure

    Every country’s markets have unique rhythms, shaped by regulation, economic cycles, and cultural attitudes toward money.

    In India, several factors make psychological awareness especially important:

    • Retail surge: More first-time investors have entered post-2020, many with limited guidance.
    • Mobile dominance: Quick access often amplifies reactivity. One alert, one tap, one decision.
    • News intensity: Indian markets are closely tied to news flow—macro, monsoon, elections, or global cues.

    All this means investors are exposed to constant stimuli. And when everything feels urgent, decisions tend to get faster—and more fragile.

    Zebu’s approach has always been to offer tools that de-escalate, not excite. Because thoughtful investing doesn’t thrive in noise.

    What Real Investors Often Say (That Reveal Mental Triggers)

    We’ve spoken to traders and investors across India who’ve said things like:

    • “It was doing fine, but I saw others exiting on Twitter, so I did too.”
    • “I wanted to wait, but I couldn’t ignore that 6% drop—it made me uncomfortable.”
    • “I doubled down because I didn’t want to be wrong twice.”
    • “It hit my target, but I didn’t sell. I thought it had more room.”

    Each of these lines tells a story—not about the stock, but about the mind behind it.

    No algorithm or technical tool can replace that inner voice. But understanding it can help you respond with more steadiness, less sway.

    Psychology Isn’t a Problem to Fix—It’s a Lens to Use

    Rather than trying to remove emotion entirely, the goal is to recognize it. To notice when it’s in the driver’s seat. To pause, even briefly, and ask: Is this decision based on what I see—or what I feel?

    Zebu’s platform encourages this reflection quietly. We don’t send urgent buzzwords. Our interface doesn’t reward clicks. We offer data, cleanly—so you can bring your own lens to it.

    Because calm decision-making doesn’t come from information overload. It comes from clarity of thought, paired with structure.

    Building Emotional Awareness into Your Approach

    Here are small, structural ways investors begin to engage with their psychology—without turning it into a project:

    • Pre-commit to thresholds: Not just price points, but reasons for exiting—profit, loss, or time-based.
    • Write down logic before entering a trade. If you’re about to act impulsively, check if the original reason still holds.
    • Track your own behavior, not just stock performance. Which trades made you anxious? Which ones felt calm? That tells you more than returns.
    • Take breaks from checking—especially during high volatility. Watching each tick doesn’t make you more informed, just more reactive.

    These are habits, not hacks. They develop over time, with intention—not pressure.

    Final Word

    Trading and investing are not just technical activities. They’re emotional journeys. Each decision—buy, hold, exit—is shaped by beliefs, patterns, reactions. Most of them unconscious.

    But with observation, that unconscious layer starts to shift. It becomes visible. And once visible, it can be worked with.

    At Zebu, we believe trading psychology isn’t something separate from investing. It’s right at the center. The better we understand how we behave around markets, the more clearly we can move through them—on our own terms.

    Not every trade will be calm. Not every investment will go as planned. But if your decisions are anchored in awareness—not impulse—you’re already trading with a different kind of edge.

    Disclaimer

    This article is intended for informational and educational purposes only. It does not constitute investment advice or a recommendation of any kind. Individual investment decisions should be made with consideration of one’s financial goals, risk tolerance, and in consultation with certified advisors. Zebu does not assume responsibility for any investment outcomes based on psychological interpretations or behavioral trends discussed in this article.

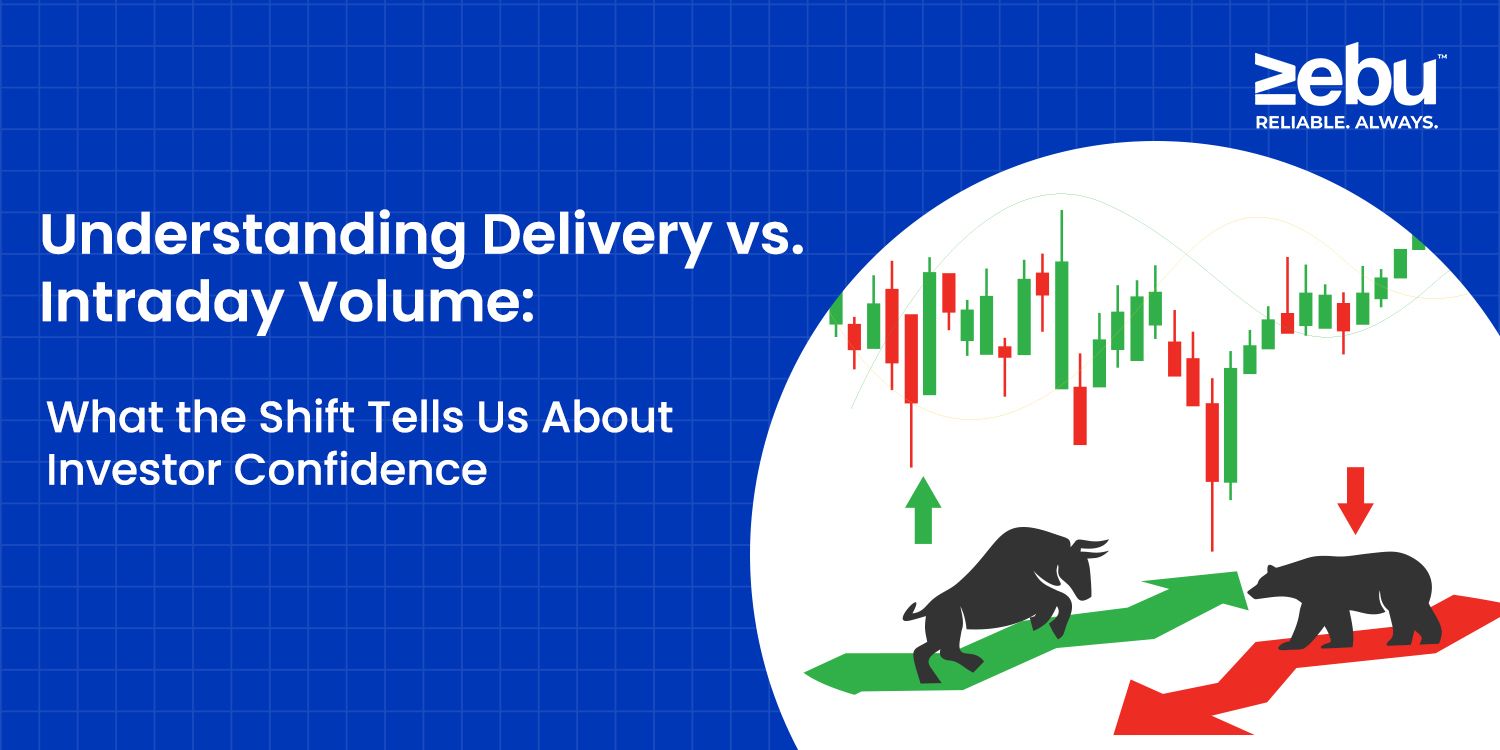
  • Understanding Delivery vs. Intraday Volume: What the Shift Tells Us About Investor Confidence

    Stock markets are often spoken about in terms of numbers—prices rising, indices climbing, percentages gained or lost. But beyond these obvious figures is another set of data that speaks more quietly, and often more meaningfully, about investor behaviour. Volume is one such indicator. Every trade that takes place in a listed company adds to the total volume. But the nature of that volume is just as important as the number itself. Specifically, whether that trade was meant to be closed within minutes or held beyond the day reveals something deeper about the market’s tone.

    At first glance, the terms “delivery volume” and “intraday volume” might sound overly technical, or even interchangeable. They aren’t. The difference between them isn’t just academic—it tells us how people are interacting with the market: whether they’re chasing a move or committing to a position.

    At Zebu, we’ve seen the difference in how these two types of activity unfold across the same price chart. One reflects immediacy. The other, intention.

    Intraday Volume: Movement Without Attachment

    Intraday activity, by definition, begins and ends within the same trading session. A person buys a stock and sells it—hopefully at a profit—before the closing bell. This sort of participation is common during earnings releases, regulatory updates, or any moment that introduces uncertainty or anticipation.

    The purpose here is singular: capitalize on movement. There is no expectation of staying with the stock longer than necessary. As such, these trades tend to spike on news and disappear just as quickly.

    There’s nothing wrong with this. Markets thrive on liquidity and participation. But when the majority of trades in a given stock are closed within the day, it’s usually an indicator that most people aren’t interested in holding. They’re responding, not investing.

    Delivery Volume: Participation with Patience

    By contrast, delivery volume measures how many trades lead to actual ownership. That is, shares that move into a demat account and are held beyond market close.

    This doesn’t necessarily mean the investor plans to keep the stock forever. It could be a short-term view, a mid-term allocation, or simply part of a larger strategy. But the point is—someone chose not to exit that day.

    That decision involves additional friction. The trade must be settled, brokerage fees apply, and unlike intraday, there’s no free exit. Even for a modest holding, taking delivery requires a conscious commitment—however temporary—to sit with the position.

    In our view at Zebu, that commitment, even when small, says something. It suggests a shift from reacting to reasoning.

    At These Behaviors Reflect

    The real takeaway isn’t that one approach is better. Rather, each type of activity tells a different story. Heavy intraday volume can indicate excitement, speculation, or volatility. Delivery volume, on the other hand, is usually a quieter signal. When it increases steadily, especially without dramatic price change, it points to something more deliberate: confidence, positioning, or the early stages of accumulation.

    These aren’t predictions. They’re patterns. And for investors who want to understand market behaviour—not just the price at which they bought or sold—recognizing those patterns adds depth to what’s otherwise just a number.

    Reading Market Tone Through Participation

    There are trading days when everything feels loud. Earnings season. Budget announcements. Global rate decisions. On such days, it’s normal for intraday activity to rise. Traders are trying to stay ahead of the news or respond to it quickly. But some of the most revealing days are the quieter ones. When there’s no major trigger, and price movement is marginal, yet delivery interest quietly builds. That shift tells you something that price doesn’t: someone sees value. Or opportunity. Or at the very least, a reason not to rush out.

    We’ve observed this across our user base—particularly among those using Zebu to track delivery percentages as part of their broader research. They aren’t looking for trades. They’re looking for rhythm.

    Sectoral Contexts: Not All Volume Behaves the Same

    Every sector carries its own relationship with volume. In banking and infrastructure, for example, it’s common to see relatively high delivery engagement. These are areas where institutions often build positions gradually. In other segments—like newer listings, or highly volatile small caps—volume can be brisk, but often lacks holding. The same stock might see interest one day, and fade the next.

    This doesn’t reflect quality. But it does affect how one might interpret the activity. A stock consistently drawing delivery even during consolidation may not attract headlines. But it’s being noticed—just not loudly.

    What Zebu Users Are Noticing

    Many users on our platform are choosing to pay attention not just to whether a stock went up or down, but how it moved. A percentage gain looks one way when most of it came from fast trades. It looks very different when most of it came from buyers who stayed. Some users track delivery interest through simple watchlists. Others monitor ratios on their own dashboards. The point isn’t analysis for the sake of analysis—it’s observation for the sake of perspective.

    Seeing delivery activity rise over a week—even without price moving much—often gives a sense that something is shifting. Not necessarily that a stock will move. But that the type of attention it’s receiving is changing.

    That, for thoughtful investors, is enough.

    A Note on Interpretation

    It’s important not to view delivery data as a signal in itself. A spike might reflect quiet buying. Or it could be the result of a one-time portfolio adjustment. It might even be a failed intraday square-off.

    So what’s the use? Not certainty. But a more rounded understanding of how the market is interacting with a stock. Not whether it will rise. But whether the attention it’s receiving is short-lived or structured.

    Delivery volume offers no guarantees. But it leaves a trail of how investors are choosing to behave. That’s worth noting.

    Tools That Offer Visibility, Not Pressure

    Zebu’s platform includes tools that help investors observe this kind of activity without demanding reaction. Charts are clean. Indicators are optional. And delivery data sits where it can be seen, but not shouted. This kind of calm interface suits a kind of investor we increasingly recognize—those who don’t want to chase. Just follow. And sometimes, stay.

    Final Thoughts

    There’s no need to become an expert in volume data. Most investors don’t need to calculate ratios or build spreadsheets. But knowing the difference between participation that comes and goes—and participation that stays—even for a little while—can reframe how you see the stocks you already hold.

    Because when the noise fades, and the price steadies, it’s these quieter signals that often offer the clearest view of confidence.

    Disclaimer

    This article is meant to provide educational insights into market activity. It does not offer investment advice, forecasts, or personalized recommendations. Investors are advised to consider multiple data points and consult qualified professionals before making financial decisions. Zebu provides tools for observation and learning, not predictive modeling.


  • The Role of Dollar–Rupee Moves in Your Equity Portfolio

    Markets rise and fall every day, often for reasons that feel close to home: quarterly earnings, local elections, FII flows, or sector outlooks. But some of the biggest undercurrents come from much farther away—currency movements, especially the USD-INR exchange rate.

    For many investors, the dollar-rupee number sits quietly in the corner of a market app—hovering between 82 and 84, rarely moving enough to make headlines. But its influence runs deeper than it appears.

    At Zebu, we often hear questions like:

    • “Does a strong rupee mean better stock returns?”
    • “Why does IT rally when the rupee weakens?”
    • “How does dollar movement affect my SIP?”

    This blog aims to answer those—gently, practically, and without jargon. Because while currency fluctuations are complex, their impact on your equity portfolio is very real.


    Why the Dollar Matters in Indian Equities

    India is a globally connected economy. Our exports, imports, foreign investments, and debt servicing are often priced in dollars. So, when the dollar strengthens or weakens against the rupee, it reshapes how Indian companies earn, spend, and grow.

    And where company fundamentals shift, stock prices eventually follow.

    For example:

    • A weaker rupee (more INR per USD) helps exporters but hurts importers.
    • A stronger rupee (fewer INR per USD) benefits companies that rely on imported inputs or overseas borrowing.

    Your equity exposure—whether through direct stocks, mutual funds, or ETFs—feels this ripple even if you’re not tracking the FX market.

    The Usual Suspects: Who’s Sensitive to Currency Shifts?

    1. Information Technology (IT)

    India’s IT services firms earn most of their revenue in dollars. So, when the rupee weakens, they convert those dollars into more rupees—boosting profits.

    A 1% rupee depreciation can lift profit margins for companies like Infosys or TCS, all else equal. That’s why IT stocks often rally when the rupee falls.

    1. Pharmaceuticals

    Like IT, pharma exports a lot—especially generics to the U.S. A weaker rupee helps earnings, though the effect depends on input costs and hedging strategies.

    1. Oil & Gas

    India imports over 80% of its crude oil. So, a weaker rupee increases costs, especially when dollar prices of oil also rise. This can impact OMCs like BPCL or IOC.

    1. Aviation

    Airlines pay for fuel in dollars. A weak rupee pushes up ATF costs. And since ticket pricing is sensitive, profits take a hit.

    1. Auto, FMCG, and Capital Goods

    Many companies in these sectors import machinery, electronics, or components. Input costs rise when the rupee falls—unless they have strong pricing power.

    What About FII Flows?

    Foreign Institutional Investors (FIIs) don’t just move money based on market potential. They also consider currency risk.

    If the rupee is falling sharply, dollar-denominated returns shrink—even if stock prices rise. That can lead to a pullback in FII investments, especially in large caps.

    Since FIIs hold big stakes in frontline stocks, their exits can affect index performance and short-term sentiment.

    How It Affects Retail Investors

    If you’re a delivery-based investor holding equity for the long term, or someone building positions via SIPs, you might wonder: “Should I worry about the dollar-rupee movement?”

    The answer is: not worry—but observe.

    Here’s why it matters:

    • If you hold IT and pharma stocks, a weakening rupee may offer tailwinds.
    • If you’re exposed to aviation, OMCs, or heavy importers, watch for rising dollar risk.
    • If you invest in broad-market funds, short-term dips from FII moves can create better entry points.

    Currency isn’t your main driver—but it’s the background weather. You don’t steer by it, but it shapes the journey.

    What the Rupee Has Been Doing Lately

    In 2025, the rupee has been trading between 82.5 and 84.2 against the dollar—fairly stable, considering global volatility.

    Some reasons:

    • India’s trade deficit is contained.
    • The RBI has been actively managing currency volatility.
    • Global interest rate cycles are moderating.

    But occasional spikes happen—due to oil prices, geopolitical concerns, or shifts in the dollar index. That’s when it helps to zoom out and revisit your sector exposure.

    Zebu’s Observations

    From a platform view, we’ve noticed:

    • Higher search interest around IT stocks when the rupee weakens.
    • Delivery volumes in PSU energy stocks rising during INR dips.
    • SIP investors adding to pharma and tech on currency-driven corrections.
    • Alert setups for “Rupee near 84” and “USD-INR crosses 83.50” gaining popularity.

    Investors aren’t speculating on the currency. But they are aligning their expectations.

    That’s smart behavior.


    How to Use This Info Without Getting Lost in It

    Currency moves fast. You don’t need to track it every day. But here’s a simple 3–point framework:

    1. Know your sector sensitivity—Review whether your holdings benefit or lose from a rising dollar.
    2. Follow INR levels at key triggers—82.5, 83.5, 84.5 are common psychological zones.
    3. Use alerts, not anxiety—Zebu’s platform lets you set price and volume alerts based on macro indicators.

    Let the data work for you—not weigh on you.

    Final Word

    The dollar-rupee exchange rate is more than a number. It’s a quiet force that moves under the surface of Indian equity investing. You don’t need to trade on it. But being aware of it means fewer surprises—and better-informed holds and entries.

    At Zebu, we’re not building tools for currency speculation. We’re building visibility—so long-term investors like you can make context-aware decisions without noise.


    Sometimes, the best equity signals come from outside the equity screen. This is one of them.

    Disclaimer

    This article is for informational purposes only and does not constitute investment advice or recommendations. Currency fluctuations involve macroeconomic and geopolitical risk. Zebu encourages all investors to consult certified advisors before making decisions based on market indicators or exchange rate movement.

  • How to Read Pre-Market Trends (Without Becoming Paranoid)

    Every morning, the Indian market opens with a mix of data and emotion. It’s not just numbers—it’s expectations shaped by what happened in New York, Singapore, or even in Brent crude futures while we were asleep. For many investors, the time between 8:30 and 9:15 is the noisiest part of the day.


    Especially on weeks like this one, where Nifty hovers near record highs, global cues feel shaky, and a couple of heavyweight stocks are due to report earnings. We’ve seen this across Zebu users: a rise in logins before 9 AM, mostly to check SGX Nifty, U.S. closes, and WhatsApp alerts. And while the instinct to “stay ahead” is understandable, it can often lead to stress that’s… unnecessary.

    Here’s a better way to look at pre-market signals. Not as warnings, but as reference points—calmly interpreted, with intention.

    What’s Actually Moving Before 9:15 This Week?

    Let’s look at the headlines that shaped Tuesday’s close:

    • Sensex and Nifty were steady above 77,000 and 23,400 respectively
    • Banking and power stocks gained, while FMCG paused
    • Crude oil prices rose slightly overnight, renewing concern over inflation-sensitive sectors
    • SGX Nifty pointed to a flat-to-negative open amid global rate jitters

    So what does this mean for your screen on Wednesday morning?

    Mostly: not much… unless you overreact to it.

    SGX Nifty: Not a Mirror, Just a Mood

    SGX Nifty is often the first thing Indian investors check. It gives a sense of where Nifty might open. But it’s not predictive—it’s just reflective of overnight sentiment, traded offshore. Today, if SGX Nifty drops 60 points, and Nifty opens down 30 and recovers quickly, that’s normal. Indian markets often adjust based on local flows and institutional action post-9:30. So glance at SGX, sure. But don’t trade because of it.

    US Markets vs. Indian Fundamentals

    Dow Jones down 0.5%, Nasdaq slips 80 points. That’s a headline. But is it a reason to exit your Hindustan Unilever position?

    Not always. Right now, Indian domestic flows are holding up well. Mutual fund SIPs, retail delivery volume, and resilient demand for PSU stocks have created a buffer. Unless the global drop is tied directly to oil, rates, or currency moves, Indian stocks may react mildly—or not at all.


    Zebu users checking U.S. closings on their dashboard should pair that with FII/DII flow summaries. Context > drama.

    Company Earnings: The One Pre-Market Cue That Matters

    This week, a few large-cap stocks are announcing results. If you hold or plan to buy any of them, pre-market action might be sharp. If the earnings beat estimates, the stock could gap up at open. But will it hold that move? Only if volumes confirm. If results disappoint, a gap down is common. But that doesn’t mean a sell-off is coming. Look at support zones and delivery volumes. Use the chart. Don’t use emotion.

    How Pre-Market Tools Help—If You Don’t Let Them Rush You

    Zebu’s platform shows:

    • Gap-up/gap-down stocks before 9:15
    • Volume spikes in early order placement
    • Sector buzz based on early interest

    But these aren’t meant to trigger immediate trades. They’re there to give you a sense of what the day might look like—not what it has to be.

    Set alerts, not alarms.

    The Best Traders and Investors Don’t Rush at Open

    Some of the most consistent users we observe log in early, yes. But they don’t place orders at 9:01. They:

    Observe index futures
    Check if their stocks are reacting to news
    Watch the first candle post-open
    Wait 15 minutes before acting

    This routine avoids knee-jerk reactions. It turns pre-market into prep—not panic.

    What to Actually Do This Morning

    Here’s a checklist for Wednesday:

    1. Check SGX Nifty — Directional cue, not a guarantee
    2. Read global close — Only act if the reasons affect your holding
    3. Look for India-specific data — FII flow, RBI commentary, earnings results
    4. Check your stock’s pre-market buzz — Gap ups, upgrades, volume
    5. Ask yourself one thing — Is this part of your plan?

    If the answer is no, don’t act. That simple filter could make your week easier.

    Final Thought: Pre-Market Is a Lens, Not a Lever

    Not every gap needs to be filled. Not every red candle needs to be caught. Not every pre-market dip means a crash is coming. Indian markets have matured. So have Indian investors. At Zebu, we’re designing tools that help you see more, not do more. Because in the 45 minutes before the bell rings, your best move is often just to observe.

    Let the market come to you. Most of the time, it does.

    Disclaimer

    This article is for informational purposes only. Zebu does not provide investment advice or guaranteed outcomes. Investors are encouraged to consult certified professionals before making trading or investment decisions based on market trends or data.

  • Why Even Long-Term Investors Should Glance at Technical Charts Amid Geopolitical Swings

    Markets move for many reasons—earnings reports, global signals, elections, tariffs, and sometimes just… mood. Lately, that mood hasn’t been predictable. One day, headlines from West Asia rattle indices. Another, an index reshuffle quietly redirects flows. But whatever the cause, the result looks the same on your screen—red, green, hesitation.

    Now, for most long-term investors in India, the instinct during such swings is to hold steady. Stay the course. Ignore the noise.

    That instinct isn’t wrong. But it’s incomplete.
    Because what often gets overlooked—especially by those focused purely on fundamentals—is the quiet value of context. And that context, more often than not, shows up in the charts. Not as a signal to buy. Not as a tip to sell. But as a way to see where you are before you decide where to go.

    When Prices Move but Nothing Else Has Changed
    Let’s say you’ve held a stock for a year. Fundamentally, nothing has changed. The company’s still making money. The business model still makes sense. Yet, the stock falls 6% in two days. If you’re like most long-horizon investors, the first instinct is to dismiss it: “This isn’t for me. I’m not trading.” Fair. But do you check why it fell?

    Sometimes the answer isn’t in the earnings reports or news feeds. It’s on the chart.

    Not in some exotic pattern or obscure indicator. Just in the simple structure—where the price was, how it moved, and whether this dip is really new or just a revisit to where it’s been before. Long-term investors aren’t chasing signals. But they do benefit from recognizing patterns. Even if it’s just to stop themselves from reacting emotionally.

    Not All Red Days Are Created Equal
    This past week, market indices dipped sharply. On the surface, it looked like panic. But underneath, it was part reshuffle (stocks entering and exiting Sensex/Nifty), part global unrest, and part positioning. Now if you’re holding stocks in passive funds or direct equities, you might have seen red. But the story was more nuanced. Charts showed something interesting. Key supports weren’t broken. Volume didn’t spike abnormally. Prices dipped, yes—but without the technical panic that usually suggests something deeper.

    If you saw the chart, you’d breathe a little easier. If you didn’t, you might’ve assumed the worst. That’s where technical analysis, even in its simplest form, earns a place—not to act, but to understand.

    Entry Isn’t Everything. But It Still Matters.
    One misconception is that timing only matters to traders. That as long as you believe in a stock, it doesn’t matter when you enter.
    That’s not quite true.

    If you’re buying a stock that’s trending down on steady volume, you might be catching a falling knife. If you’re buying when the price is consolidating at a support level, you might be giving yourself breathing room. That doesn’t make you a trader. That makes you deliberate.

    Platforms like Zebu now make these tools available with minimal friction. You don’t have to open a new app or download a plug-in. The chart is just there, next to the fundamentals tab. No noise. Just a little bit of structure in a chaotic space.
    What Can a Chart Really Tell You?
    Here’s what you don’t need:

    You don’t need to know what RSI divergence is.
    You don’t need to draw Fibonacci arcs or recognize cup-and-handle formations.
    Here’s what you can do with basic chart awareness:
    See if a stock is consistently making higher highs or lower lows
    Notice if recent dips are on heavy or light volume.
    Check whether the price is near a commonly watched average like the 200-day line.

    That’s it. And that’s often enough.

    Glancing ≠ Trading
    This part matters. Glancing at charts doesn’t turn you into a trader. It doesn’t mean you’re abandoning fundamentals. It doesn’t mean you’re reacting to every tick. It means you’re willing to observe. Because sometimes the chart shows that a fall was expected. That the price is simply revisiting its prior level. And that gives you calm. Not conviction. Not certainty. Just clarity. You still stay the course. You just understand the terrain a little better while you walk it.

    Case in Point: Passive Investors, Active Minds
    Even index investors are affected by these swings.

    Take the recent Sensex reshuffle. Passive funds had to adjust. Stocks like Trent and BEL saw inflows. Others saw outflows. If you were watching only fundamentals, it looked random. But the chart showed otherwise. Momentum had been building.

    The addition to the index was a trigger—but not the start.
    A glance at the chart would’ve told you the story had been unfolding long before the headlines caught up.
    The Mobile Factor: Charting at Arm’s Reach
    If you’re using a mobile trading platform, you already know how easy it is to check a chart. It takes five seconds. Two taps. And most platforms (Zebu included) let you change timeframes, add a moving average, and check basic volume—all without leaving the screen. This isn’t power-user behavior anymore. It’s baseline awareness.

    And the fact that so many investors are doing this quietly—from Kochi to Kanpur—without making noise about it, tells you something. That the lines between “fundamental” and “technical” aren’t as sharp as they once were. They’re merging. Not because of theory. But because of need.

    What Not to Do
    Here’s what this blog isn’t saying: Don’t try to time every buy or sell based on lines and candles. Don’t abandon your long-term view because a support broke. Don’t get drawn into signal-chasing because someone on Twitter posted a breakout alert.

    The goal isn’t reaction. It’s recognition. The chart is a mirror, not a map. You can look into it. But you don’t have to walk in the direction it points.

    Some Days, a Glance Is Enough
    Sometimes, you just want to know: “Is this panic, or is this pattern?” You’re not going to act today. You just want to know whether you’re walking into a room with the lights on or off.

    A chart can’t tell you the future. But it can tell you what happened. And in a world where headlines twist fast and numbers feel noisy, that retrospective view is underrated. It won’t make you rich. But it might make you calmer. And if you’re playing the long game, calm might be your most valuable asset.

    Disclaimer
    This article is intended for informational purposes only. It is not financial advice or a recommendation to trade. Zebu does not guarantee investment outcomes or returns. All decisions related to stock trading and investing should be made based on individual goals and after consultation with a certified financial advisor.

  • Why Technical Analysis Isn’t Just for Traders—And How Long-Term Investors Are Quietly Using It Too

    There’s this idea that floats around every new investor community—that technical analysis is only for the fast-money folks. You know, the intraday crowd. Candles, charts, scalp trades, the works.

    But that’s not entirely true. And maybe it never was. Because what’s happened, quietly, is that a lot of long-term investors—not the ones yelling “buy the dip” on social media, but the quieter kind—have started borrowing from the trader’s toolkit. Not to trade more. But to see better.

    And honestly? It makes sense.

    What Even Is “Technical” Anyway?

    At its core, technical analysis is just the study of price and volume. Not what a company says. Not what the economy’s doing. Just how the stock has moved. Where it paused. Where it collapsed. Where people seemed to care—and where they didn’t.

    Some folks turn that into a full-time system. Patterns, indicators, backtests. But you don’t have to go that far to get value. Sometimes, all it takes is pulling up a one-year chart and asking: Did this stock make higher highs or lower lows? That’s not trading. That’s observation.

    The Long View Still Has Patterns

    Say you’re thinking of holding a stock for the next three years. Cool. But when are you entering? Random day? Or when the price’s finally stopped falling after months of drift? Some folks time their entries based on analyst reports. Others look for “support zones.” You’d be surprised how often those zones appear on basic charts—even for blue-chip companies.

    It’s not about catching the bottom. It’s about avoiding entries where the floor’s still collapsing.

    That’s where technicals help.

    Investors Use Fundamentals. But They Don’t Live Inside Them.

    Even the most patient, valuation-focused investor isn’t staring at balance sheets every week. Once you’ve done the math, what you’re watching is behavior. Does the market agree with your thesis? Is volume picking up? Did something change?

    That’s chart-watching.

    Maybe not with Bollinger Bands or MACD. But with intent.

    Zebu’s platform, for instance, doesn’t force traders to choose. You can check earnings, then flip to a 3-month chart. It’s fluid. Not segmented. That blending—that’s how modern investing looks now.

    Avoiding Painful Timing

    Let’s be honest. Some investors get the company right, but the price wrong. They buy too early. Or just before a correction. And sometimes, all they needed to do was zoom out.

    • “Was this stock in an uptrend?”
    • “Did it just break below its 200-day average?”
    • “Was there a sudden spike in volume on a red candle?”

    None of that requires being a trader. Just curiosity.

    Tools Aren’t Just for Trades

    You don’t need to draw trendlines or scalp intraday to use RSI. Or moving averages. Even the most conservative investors use basic technical indicators to confirm if the market’s in sync with the company’s story.

    It’s like checking weather before a road trip. You’re still making the journey. You’re just smarter about when you leave.

    The Psychology Side No One Talks About

    One reason long-term investors started checking charts? To keep their own heads calm.

    When a stock drops 5% in a day, it’s easy to panic. But a glance at a chart might show you it’s just revisiting a previous support. Or still within a larger trend. That single visual—red candles stacked but staying above a known level—can be more calming than re-reading the last five annual reports.

    Nobody’s Asking You to Become a Day Trader

    This isn’t about switching styles. It’s about seeing more. If you use SIP calculators, you already use tools. This is just one more. Charting tools don’t tell you what to do. But they can help you frame better questions. Like: “Has this level ever held before?” Or: “Is this rally happening on volume, or just air?”

    Simple stuff. But helpful.

    Even Mutual Funds Use Charts

    This part might surprise you. But even large institutional funds—those big, buttoned-up ones—watch technical indicators before making huge allocations. Not always for timing. But for reading sentiment. Because if a fundamentally great stock is sliding below key levels on high volume? That says something. Doesn’t matter what the PE ratio looks like.

    If You’re on Mobile, It’s Even Easier

    On Zebu’s mobile platform (or any serious one, really), the shift between reading a news headline and looking at a daily chart is one swipe. You don’t need to open ten tabs. Just check.

    That kind of frictionless movement—that’s how technical analysis stops being intimidating. It starts becoming… normal.

    Final Thought: It’s Just One More Lens

    Fundamentals tell you what a company is. Technicals tell you how the market’s treating it. You don’t need to marry either. But it’s probably wise to date both. Because the modern investor? They’re not just buying a stock. They’re buying time. And tools help them spend that time better.

    Disclaimer

    This article is intended for educational purposes only. It is not investment advice or a trading recommendation. Zebu offers access to tools and information to support user decisions, but individual outcomes may vary. Please consult a licensed financial advisor before making financial decisions based on market data or chart analysis.