Category: Trading

  • The Pros and Cons Of Intraday Trading

    Intraday trading seems to be picking up steam in India with more traders opening demat accounts everyday. Even though it might seem like a lucrative career option, it comes with multiple issues as well. Here are the pros and cons of intraday trading.

    1. Quick Money

    Day trading, unlike long-term investments, can bring in money very quickly. The profit or loss will be displayed in your trading account right away, based on your exit plan and performance. You can choose whether to put the money in your bank account or put it back into your trading capital pool.

    2. No danger at night

    By not leaving your stocks on the market overnight, you can reduce the risk of overnight volatility when you day trade. Stock prices often change between when the market closes and when it opens, because of news and other things. This change could have an effect on the price of the stock.

    3. Make money in down markets

    One of the best things about day trading is that you can still make money even when the market is down. Instead of buying a stock, you can sell it short and then buy it back to make money. So, you can make money whether the market is going up or down. This benefit isn’t usually a part of investment opportunities.

    Dangers of day trading

    There are also some bad things about trading every day. If you want to be a successful trader, remember these problems so you can avoid them.
    Consistency is needed to deal with risk in markets that change a lot.
    The chance of losing money

    How to Start Trading Day Trading

    Before you can start trading on the stock market, you have to open a trading account and a DEMAT account. If you are an experienced trader who wants to try stock market intraday trading, you might open a new account to keep your trading separate. When you have different accounts, it’s easier to keep track of things. Due to the different ways that intraday trades are taxed, setting up a separate account makes tax calculations easier. Open a demat account with Zebu to benefit from a host of tools and benefits.

    After that, you can sign up for the tools you need for intraday trading. You can obtain various tools to help you with intraday trading after creating an account. Spend some time looking at daily charts before you start trading so you can become familiar with the patterns of price movement. There are many courses available that offer technical analysis education, and these could also be beneficial.

  • Rules That Every Intraday Trader Should Follow

    By following a few simple rules, an intraday trader who is just starting out can increase their chances of making money and decrease their chances of losing money. Here are some of the rules that you must know.

    Don’t use your full capital:

    Even if you like the excitement of the stock market, it’s not a good idea to put a lot of your money into “intraday trading.” Don’t put in more than you can afford to lose. Don’t put more money into trading than you can afford to lose, even if other traders are doing well.

    Exit at the end of the day:

    Always close out your trades at the end of the day. Do not keep holding onto securities in the vain expectation of making more money or minimising losses the following day. This rule is applicable especially if the general climate of the market indicates volatility.

    Watch the market at all times:

    You can’t have all-day business meetings or long flights when the market is open. You have to be quick and aware to make the deal when the price is right. If you don’t keep track of how your chosen stocks rise and fall, you might miss out on a good selling price.

    Exit as soon as the trend goes against you:

    As soon as you realise that the market has gotten worse, you should get out. If you wait until the stop-loss conditions are met, it may be too late and cause you to lose more money. With experience, you can become a discretionary trader instead of a systematic trader.

    Don’t put money into too many marketplaces at once:

    Based on the quantity of capital you have, choose your market. Most of the time, you need the least amount of money to trade on the currency market, while you need a little more money to trade on the stock market.

    Find the best time for trading during the day and stick to it:

    Develop and use a good intraday trading strategy over time and with more knowledge. Intraday trading is all about finding a method that works for you and using it over and over again to make more money.

    Stocks that are good for intraday trading should have volatility that ranges from moderate to high and be easy to buy and sell. For a beginner, it’s best to start by focusing on just one or two stocks at a time.

  • Things Beginners Should Keep In Mind While Doing Intraday Trading

    Intraday trading is the act of buying and selling stocks and ETFs during regular trading hours within the same day. You can buy or sell shares quickly without having to go through the trouble of getting real share certificates. Intraday trading is based on the idea very short term price movements can be capitalised. Shares are bought for less money and sold for more money. The difference between the two rates is the profit.

    Understand how investing and trading are different.

    Trading and investing are two very different ways to put money to work. Just because you know how long-term value and growth investments work doesn’t mean you’re automatically good at day trading. For day trading, you don’t use the same criteria to choose stocks as you do for long-term investments. Day trading uses market volatility to make money, but long-term investments are made so that they can handle daily market volatility.

    Let’s take a look at the basics of intraday trading in India.

    Choose stocks that are easy to buy and sell:

    Day trading requires you to close out your position before the end of the day. If you buy a stock that doesn’t have enough liquidity, you might not be able to sell it when you want to. One of the most important rules of day trading is to only trade in liquid stocks. When there is enough liquidity, there are no limits on how much can be traded. When there are a lot of buyers and sellers of liquid stocks, the prices fluctuate, which is what day traders need to make money.

    Research:

    Day trading is a sure shot way to lose your capital if you do not do your research. Before you buy or sell any shares, you should do a lot of research on them. Choose stocks in a field you know a lot about. Before you start trading, watch how the prices of the shares you’ve chosen change, as well as other signs like volume and liquidity.

    Choose stocks in the same trend as the broader index:

    Price changes can be caused by many things, but some stocks move in the same way as larger indices. For example, these stocks will go up if the Nifty goes up and down if the Nifty goes down. But a large number of stocks don’t follow a predictable pattern, so you should be careful when dealing with them.

    Recognize the right price:

    If you want to make money on an intraday trade, you must choose the right entry and exit prices. Traders use support and resistance levels in a number of ways to choose the right entry and exit prices. Some traders close out their positions when a trade starts to make money, while others choose to go with the trend. Your approach might be different, but you should always keep your cool and stick to the plan.

    Set up a stop-loss:

    Brokers offer a lot of leverage for intraday trading, which increases both the chance of making money and the chance of losing money. Setting a stop loss is important because day trading can lead to big losses. A stop-loss limit closes your position when the share price goes over a certain level.

    These are some of the must-know tips for beginner traders who are looking to trade in equity in the share market online.

  • The Beginners Guide To Open Interest For Intraday Trading

    Intraday trading is a word that means exactly what it says: trading that takes place during the same day. One thing an intraday trader needs to understand is what is called “open interest.”

    What is open interest?

    In its simplest form, open interest (OI) is the number of active contract numbers at the end of each trading day. These are positions that are still open and haven’t been closed yet. Open interest is a way to measure how busy the futures and options markets are in general. For every new position that a buyer and a seller take, the open interest goes up by one contract. When traders close their positions, the number of open contracts goes down by one. If a seller or buyer transfers their position to another seller or buyer, the open interest doesn’t change.

    If the OI has gone up, it means that the market is getting more money. If the OI is going down, the current trend in prices is about to end. In this way, the OI shows how prices change over time.

    It describes participation

    Traders should also know that open interest and volume are not the same thing. Volume is the number of contracts that are bought and sold in a day. Volume is a measure of how many contracts have been made between the seller and the buyer. This is true whether a new contract was made or an existing contract was changed. The main difference between open interest (OI) and volume is that OI shows how many open and active contracts there are, while volume shows how many were actually executed.

    How prices change and what they do

    Another thing to think about when talking about OI is how the price moves. In trading, price action is the way a graph shows how the price of a security changes over time. It refers to whether the price of a certain security is going up or down.

    Most traders analyse the market based on volume, Open Interest (OI), price, and other market indicators. In general, a market is strong when the price is going up, the volume is going up, and the OI is going up. On the other hand, a market is weak even if the price is going up if the other two indicators are going down.

    Here are a few tips for traders who want to use OI to keep an eye on how the market is doing:

    When the OI goes up and the price goes up at the same time, there is a lot of money coming into the market. It shows that there are buyers, so it’s seen as a good sign for the market.
    – When prices are going up but the OI is going down, money may be leaving the market. This means the market is going down.
    – Even if the OI is sky-high and the price drops sharply, this is still a bearish sign for the market. This is because it looks like people who bought at the peak have lost money. In this case, there is a chance that people will sell out of fear.
    – If prices are going down and the open interest is also going down, it means that holders are feeling pressured to sell their positions. This shows that the market is bearish. It can also mean that the best time to sell is coming up.

    OI is important because it shows how many contracts are open or active in the market. When more contracts are added, OI goes up. When a contract is squared off, the open interest goes down. Volume is another word that is often used with the term “open interest.” The volume shows how many trades were made on a certain day. It doesn’t last into the next day, though. On the other hand, OI is live data because it affects what happens the next day.

    Together, open interest, price, and volume data help intraday traders understand how the market is doing. Using this information, an intraday trader can figure out if the market is going up or down.

  • How To Choose Stocks For Swing Trading

    You might know what swing trading is, but might not know where to begin. A good swing trading strategy starts with learning how to find stocks for swing trading. Swing traders carefully choose stocks that have a good chance of doing well in the future. This lets them take a much larger share of the market. How do they do that, though? Let’s look into swing trading’s mysteries.

    With swing trading, you can make money from market changes that happen over a few days or weeks. Like day trading, it gives traders the chance to make money when the market moves in their favour. Your strategy for trading will be built on your ability to pick the right stocks. Like day trading, you would also have to choose stocks with high liquidity and the chance of big changes in price and volume. So, let’s talk about how to find stocks that are good for swing trading.

    How to Pick Stocks for Swing Trading: The Simple Rules
    Swing traders will always swear by a few general rules. Of course, you can make your own plan and put it into action, but having one or two of these is a great place to start.

    Market direction

    When trading, traders follow a rule that says if a stock’s value is going up in the current market, it will keep going up if the market stays the same.

    You can find the best-performing stocks in a number of ways, such as by reading company news, looking for the best stocks on the market, or keeping an eye on stock indices.

    Orientation bias

    Swing traders look for possible buy or sell signals to find opportunities. They use a mix of basic information and technical analysis to find industries and stocks that do better than indices for a large part of the trading day. They sort through the stocks to find ones that have the right amount of volatility and volume to store their expectations. This process, called “screening stocks,” is made up of the following steps.

    Liquidity is a very important metric for swing traders. The number of times a stock trades each day shows how popular it is on the market. How often a stock trades on the exchange tells you how liquid it is. If a stock trades a lot every day, it is considered liquid enough for swing trading. Stocks with a lot of trading show less risk.

    Performance is a way to compare how well a stock has done compared to other stocks in the same industry. The goal is to find the best stocks in each sector that have done better than sector indices.

    Swing traders look for stocks that trade in the same way over and over again. They think that a pattern that keeps coming up is more reliable. Experienced traders will wait for the stock to break out of its trading range before they decide when to buy or sell. They might make a few small profits while they wait by trading in the direction of the trend.

    Some swing traders may like stocks that are less volatile and have a clear uptrend. They stay away from stocks that are prone to big drops and selling for no reason. Instead, they would keep holding on to stocks whose prices didn’t change much and had no gaps in the price line.

    Correlation and volatility: Stocks that go against the market trend may look good, but most swing traders will stay away from them. It makes sense to stay away from stocks that aren’t stable and instead focus on those that track key market indices. Look at how a stock has been acting in the past to figure out why it is acting the way it is.

    Another important factor is how volatile the market is. Volatility is a way to figure out how much a stock price will change, if the target and stops are reasonable, or if the risk criteria are good enough for the amount of time the trader wants to keep the position open.

    Conclusion

    After we’ve talked about how to swing trade stocks, it’s important to know that swing trading is riskier than day trading because it involves keeping stocks for a longer time. You need a strong strategy to help you find trade opportunities and possible red flags.

    When picking stocks for swing trading, investors should keep in mind that there are other ways to do things besides the ones described in this article. Every trader needs to come up with a plan that works for them.

    Whether you swing trade or not, it will help you a lot in the stock market to know how to find stocks to swing trade. You can use this information to make trading plans that will make you money and to learn more about how stock prices move.

  • Swing Trading Vs Intraday Trading – Which One Should You Choose?

    Let’s start by understanding the different ways of trading. The main differences between the two ways of trading are investment, commitment, and time. Traders choose different trading strategies based on time, money, and psychological factors.

    Intraday Trading

    The Financial Regulatory Authority (FINRA) says that day traders are people who do many “round trips,” at least four of which happen every five days. Day trading might be the most common way to trade. Most traders are day traders, which means they make money from the price changes on the market during the day. All-day trading takes place in a single day, as the name suggests. Traders open a number of positions during trading hours, which they all close before the end of the day.

    Day traders use technical analysis and tools to get real-time updates. They often trade full-time and keep a close eye on the market for business opportunities. At least in terms of percentages, day trading gives people with small trading accounts more chances to make money. They don’t try to make a lot of money from one trade. Instead, they should do a number of transactions to make enough money.

    In the end, day trading is a type of high-frequency trading that involves small amounts and always buys stocks for less than what they sell for.

    Swing Trading

    The main difference between day trading and swing trading is the length of time. During a swing trade, days or weeks can go by. Swing traders don’t make a trade until they see a pattern. They don’t trade full-time, but they use both fundamental and technical research to spot trends as they happen and trade in line with them. They would look for stocks that could make them the most money quickly. There is more risk, but there is also more chance of making money.

    Differences between day trading and swing trading that are important to know

    Swing trading and day trading are both types of trading, but they are not the same. Here are some of the most important differences between the two ways of trading.

    • Day traders buy and sell a lot of different stocks in the same day. Swing traders buy and sell a number of stocks over a longer time period (usually between two days to several weeks). So that they have a better chance of making money, they look for a pattern of trends.

    • Day traders will close out all of their positions before the closing bell rings. Swing traders would hold their position for at least one night before settling it the next day.

    • Swing traders only work for a few hours each day. They don’t spend the whole day tied to their computers. Day trading takes a lot of time and commitment.

    • Day traders make a lot of trades every day, which increases their odds of making money. Gains and losses, on the other hand, are smaller. Swing trading has fewer wins and losses, but they are often bigger.

    • Day traders need the newest hardware and software. Day traders must have extremely rapid trigger fingers. You don’t need complicated or cutting-edge software to do swing trading.

    A trader’s main goal is to make as much money as possible. So, between swing trading and day trading, which is better?

    Even though both ways of trading have many pros, you should be aware of their cons before choosing one. The list that follows goes over the pros and cons of each one.

    • Swing trading needs less attention because it takes place over a longer period of time. Day trading, on the other hand, requires regular market watching and quick decisions.

    • Day traders try to make as many trades as possible to make the most money in a single day, while swing traders try to make a big profit.

    • Swing traders take on more risk when they leave their position open overnight. On the other hand, day traders close their trades at the end of the day. So, there is no longer any risk.

    Swing traders wait until a deal has been going on for a while before using that time to watch how the market moves. It helps make things safer. Day trading is easier for most traders to do because it needs less capital than swing trading. Day traders have to make trades quickly because one loss could wipe out their whole day’s profit.

  • The Anatomy Of A Perfect Breakout Trade

    Buying the breakout is a strategy in which you wait for an asset’s price to turn around and then try to invest in the early stages of its rise. (Some traders also use the word “breakout” to describe sharp price drops that happen after a time when prices went up or were stable.) When the decline stops and things start to get better again, this is called a “breakout.” The goal is to come together before the asset gains a lot of value.

    A retest happens when a stock price breakthrough is followed by a trend reversal and a return to a predetermined price range, such as the area around its 21-day simple moving average. Most of the time, the price goes back to where it was before the breakout. After that, it goes back to the way it moved before it broke out.

    When you buy the retest, you wait until after the breakout and buy the asset when it goes back into the range it was in before the breakout. This is helpful because it lets you move more methodically. You don’t have to invest right away because you don’t want to miss out. A retest also usually means that prices will be more stable in the future. The second breakthrough price range is more likely to hold.

    The problem with buying the breakout is, of course, that you can’t be sure when a breakout will happen until it has already happened. Even if an asset continues to lose value, its price can change from time to time. Sometimes, though, the asset has been revalued over a long period of time. In this case, any price changes will be made within a range of the new normal. You try to be right by making the best guess you can about what will happen to the price.

    And the problem with waiting for a retest is that it may never come. A very powerful breakout might be so strong that the price might breakout of a range and never move back inside if it. That is why, it is important for you to perform your own backtests and ensure that you choose a versatile strategy that lets you make the most of it.

    The most common indicator that intraday traders use to trade retest breakouts is the VWAP. It is the Volume Weighted Average Price that the price often moves to before moving again. For example, you mark the high and low of the 15 minute range of Nifty, and see a breakout happening at the high, then wait for it to come back to the VWAP before initiating a long trade. This will give you an attractive Risk:Reward Ratio.

    If you would like to start trading breakout strategies, open your best trading account with Zebu today.

  • What Should You Consider While Backtesting A Strategy – Part 2

    Sharpe Ratio: The risk-adjusted returns, or reward-to-risk ratio, is found by dividing the annualised return by the annualised volatility.
    With the Kindino Ratio, negative returns are taken into account by dividing the annualised return by the annualised volatility of negative returns.

    In the last section, we talked about how volatility was a way to measure risk. We have these two measurements because we know that not all risks are bad. Sharpe looks at all kinds of volatility, while Sortino only looks at downside volatility. Here is where they part ways. Most of the time, you want a high Sharpe and a high Sortino.

    The right way to count costs

    When analysing trading techniques, it’s also important to think about how much it costs to make the trades that need to be made. One of the main reasons for this is that beginners often think their techniques are better than they really are.

    Many quants think that the only costs of a trading strategy are the commissions that have to be paid to brokers. Two more important examples are:

    Commissions

    As you may already know, it’s hard to trade without a broker. In exchange for money, brokers provide transaction services and act as an exchange. Brokers sometimes add on extra costs and fees that you might not expect. This includes any extra services, fees set by the exchange, and taxes the government might charge for the financial transaction.

    Slippage

    Slippage is a key feature that is often overlooked when evaluating. Slippage is when the price you wanted to trade at is different from the price you actually trade at.

    Why do these prices vary from each other? There could be many things going on. For example, you might have wanted to buy 100 shares of Apple at $100 each, but only 50 people were willing to sell at that price and another 50 at $101. Your loss would have been 50 cents, and the price you would have traded at is 100.50.

    Slippage, which is part of transaction costs, can quickly turn a strategy that should be profitable in theory into one that doesn’t work. In the previous example, if you had planned to sell your shares for 102 dollars, slippage would have cut your profit by 25%. Slippage can be reduced by making a good plan for execution, but it’s important to know how it might affect your deals.

    A few words about the biases we all have

    Everything comes from within, including both profit and loss. Even though the market and how volatile it is play a big role in how much money we make or lose, we always let an inner voice guide us when we make a trade. Some of these voices can be helpful, but most of the time they come from people’s biases. We often feel a wide range of emotions and have to make decisions we weren’t supposed to make because of these kinds of personal biases. We need to control our emotions and personal preferences if we want to know when to stop a trade and when to keep going with it.

    We can’t make good decisions when we’re feeling a lot of different emotions, so these are important things to look at when judging a trading strategy. Some emotions that can make it hard to think straight are excitement, thrill, hope, fear, worry, and panic. These are the emotions that drive us, so keeping an eye on them when it makes sense will always help us do better in a trade.

    If you want more information on this, we also have a page about biases in backtesting and risk management. This will tell you more about your own biases and how to avoid them so you can trade better.

    Most of the time, these are some of the things that are used to judge a trading strategy. Don’t be afraid to write things down as you try to use them in your plan. Once you’ve looked at the results, you can start making changes to improve the way your transactions work.

  • What Should You Consider While Backtesting A Strategy – Part 1

    Backtesting is a very useful way to figure out how our trading algorithms might work in real life (might is the key word). But it can be hard for a data scientist who doesn’t have a background in finance to understand what it all means. Sharpies or Sortinos? Returns or profitability with money? This shouldn’t stop you, though, because some of the best funds in the world are run by people who aren’t in finance. Instead, it’s time to learn.

    In this article, we’ll talk about some of the most important ways to tell if your trading strategy is working or not. If you really understand these basic indicators, you’ll have a good basis for judging different strategies.

    Setting Up Performance Measures

    These are some of the first criteria or measures you could use to figure out how well your trades are going. Most of the time, the measurements focus on two important parts of a strategy: the change in the value of the portfolio and the risk of making those gains or losses. By understanding these two things, you can figure out what it does well and where it falls short.

    Financial metrics

    All of the metrics in this section tell you how much money you made (or lost) when you used a certain strategy. The final amount of money is a good place to start, but there are other signs that give us more information:

    Annualized Return: The average annual percent profit from your trading strategy (or loss).

    Win/Loss, Average Win/Loss: Total (or Average) (or Average) Profits from Trades That Work The total (or average) amount of money lost on trades that go wrong.

    % Profitability is the number of profitable trades out of all of them.

    When we talk about return on capital as a percentage, we usually mean that the strategy is a multiplier on your initial capital. This is helpful most of the time, but we should remember that it’s only partly true.

    Next, if we want to fully understand a strategy, we need to know how we are making money. For instance, do we consistently make tiny wins or do we consistently make small wins followed by massive losses? By looking at different combinations of profitability, win/loss, and profit/loss, we might start to understand how our plan will work.

    Metrics that focus on risk

    It’s just as important to see big profits as it is to know that the method could lose money in the long run. “No risk, no reward” is a saying that only winners use. The vast majority of people whose risky bets didn’t pay off don’t say it. Here, the following crucial metrics are important:

    Annualized Volatility: The standard deviation of the model’s daily return over a year. Since volatility is used to quantify risk, a model with a higher vol indicates greater risk.

    Highest Drawdown: The most negative change in the value of the whole portfolio or the biggest drop in PnL. It is based on the biggest difference between the high and the next low before a new high is set.

    Since our backtest will always cover the whole period, drawdown is an important risk factor to think about, but we’re much less likely to keep a losing trade open in real life. If you had bought Amazon stock in 1998, it would have been smart to keep every share and buy as much as you could during the dotcom bust. In reality, not many people would keep going with a deal if their money dropped by 10%, 20%, 40%, 80%, etc.


  • What is Acid Test Ratio And How Can You Use It While Investing?

    The acid test ratio, which is also called the quick ratio, is a financial measure of how quickly a company can pay off its current debts. Current obligations are debts that have to be paid back within a year. For example, a credit card balance is a current obligation.

    The ratio shows how well the business is doing financially right now.

    If a company’s acid test ratio is less than one, it usually means that its current assets are not enough to pay off its short-term debts and liabilities. A very high ratio suggests that money has been saved up and is just sitting there, not being put to good use.

    It’s important to know that when figuring out the ratio, the company doesn’t count current assets that are hard to sell quickly.

    How to find the acid test ratio

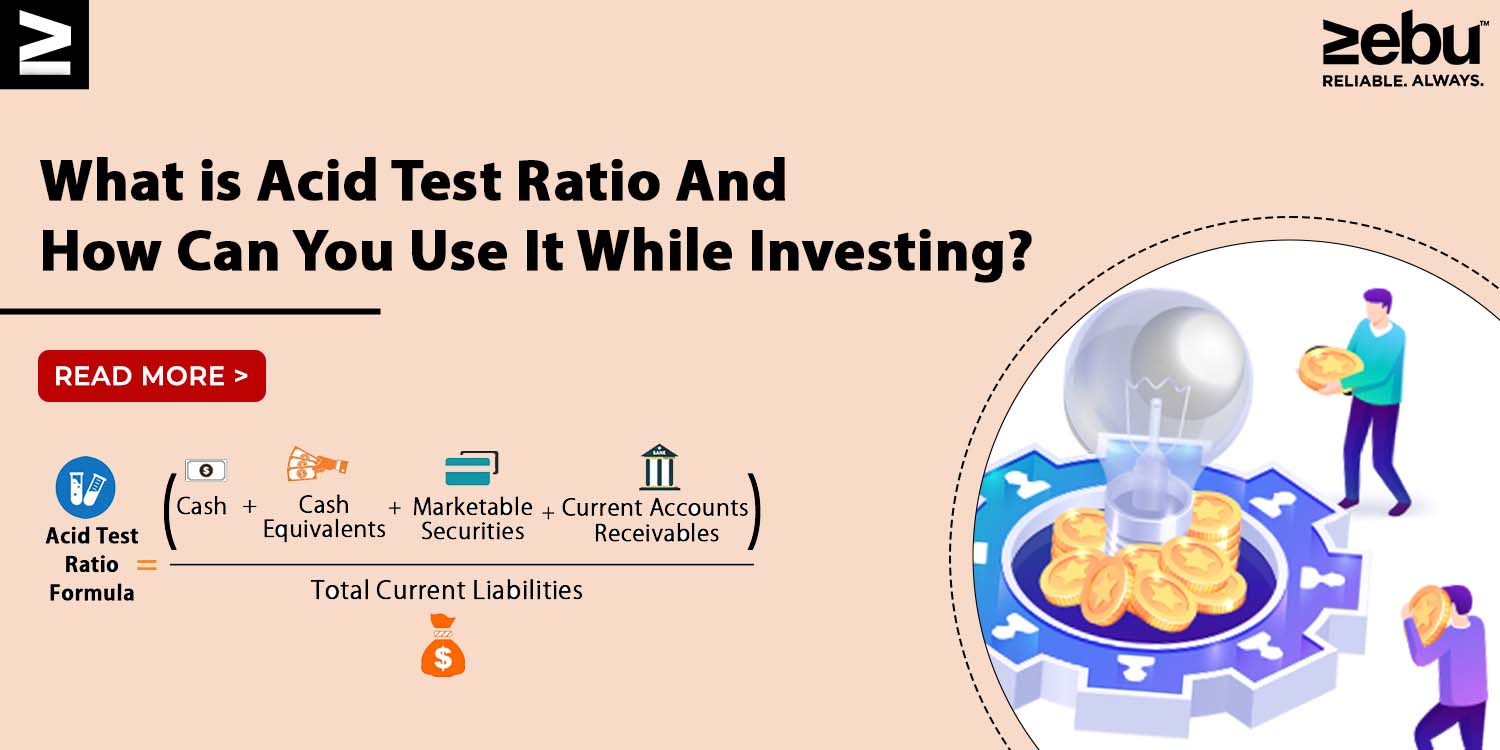
    The acid-test ratio is calculated by dividing current liabilities by (cash + accounts receivable + short-term investments). Cash and assets that can be used as cash must be included. There must also be marketable securities and other assets that can be used quickly. Accounts receivable are usually covered, but not in every business. If assets on a balance sheet, like loans to suppliers, prepayments, and deferred tax assets, can’t pay off liabilities in the near future, they must be taken off. The denominator should include all current liabilities, which are debts and commitments due within a year.

    The limits of the Ratio

    If the company’s financial data is inaccurate, it will have accounts receivable that require longer than usual to be collected.

    Also, it gives a false picture of the current liabilities that are due but won’t be paid for a while.

    A low acid test ratio doesn’t always mean that a business strategy that depends on stock is in bad financial shape.

    The acid test ratio is different from the current ratio

    The current ratio, also called the working capital ratio, shows how quickly a company can make enough cash to pay off all its debts if they all come due at once.

    On the other hand, the acid test ratio is a more cautious measurement.
    While the current ratio includes assets that can be converted to cash within a year, the acid-test ratio only includes assets that can be done so within 90 days or less.