Category: Trading

  • Understanding Block Deals And Bulk Deals

    Today, a lot of different people trade and invest in the stock market. There are also a number of strategies used when trading shares and orders are constantly being placed. Aside from the very common retail investor, large corporations and institutions like hedge funds, mutual funds, investment banks, pension funds, HNIs (high net-worth individuals), FIIs (foreign institutional investors), and company promoters also buy and sell shares on a large scale

    As an online brokerage firm we understand the nuances of trading, hence offer our best services to our customers, including providing our users with the best trading accounts and lowest brokerage options.

    Stock Market Biggies

    These big players come to the stock market with a lot of money and a good understanding of the companies they want to put their money in. The average investor is small compared to these big players in the market, so they don’t have access to this special information that big investors do. Because of this, the ways that big investors trade and invest in the stock market today are different from those of small investors. These big investors do large deals, which are called bulk deals and block deals. Even though they sound the same, you need to know that they are not the same.

    Block Deals

    To know how block deals and bulk deals are different, you need to know what each means. First, you need to understand what a block deal is. A block deal is a single trade in which more than 500,000 shares are traded or a trade in which the value of the shares traded is more than Rs. 10 crores. In 2017, SEBI, which stands for the Securities and Exchange Board of India, changed the value of a block deal to Rs. 10 crores. Block deals happen on the stock market during a certain time called the “block deal window.” Block deals happen in a special trading window that retail investors can’t see. There are no value charts for these deals on any trading platform either.

    In a special “trading window,” block deals are made in two 15-minute shifts. A Block Reference Price is used to figure out how block deals are made. In block deals, orders that aren’t filled are cancelled and don’t move on to the next trading window.

    Bulk Deal

    When at least 0.5% of a company’s listed shares are traded, the deal is considered a bulk deal. In contrast to block deals, bulk deals take place during normal trading hours on the stock market. Again, unlike block deals, details of bulk deals are not kept secret from other market participants like small investors. On different trading platforms, they can be seen on the volume charts. Because bulk deals are visible to other market participants, they can affect stock prices in real-time and in a dynamic way. When a broker does a bulk deal on behalf of investors, he or she must share the details of the deal, such as who is involved, how much is being traded, etc.

    Other differences between block and bulk deals include the fact that bulk deals can be done during the trading window for block deals if they meet the conditions for block trading. For example, if the value of the transaction is more than 0.5% of all the listed shares of the company and more than Rs. 10 crores, participants can choose to trade during the block window or on a normal trading day. If the people involved want the details of the deal to stay secret until they are shared with the exchanges, they can choose to do the deal in the trading window.

    How Prices Change for Bulk and Block Deals
    Any big deals on the stock market today have to affect smaller investors (and some large ones). They get people’s attention because of how big and important they are. Investors think that the stocks involved in such deals must be real. Bulk deals and block deals may show that more people are interested in a stock or that fewer people are interested in it. These signals must be taken seriously. Also, before you decide to trade, you should look at other indicators and trends. Even if a bulk order is filled, it doesn’t mean that a certain stock is likely to move in the same direction as the bulk trade. Still, repeated bulk trades in the same direction (either buy or sell) may show interest in the stock in that direction.

    As an individual investor, you may need to buy or sell stocks in smaller amounts with the help of a trading account that is linked to a Demat account. When you open a Demat account, you probably don’t think that block deals and bulk deals can be as big as they often are in the markets. But these deals, which are used by large funds, high-net-worth individuals, and institutional investors, move a lot of money on the stock market today. During normal market hours, big deals happen that everyone can see. When block deals are done in certain trading windows, the parties involved have a little more privacy. Still, bulk deals must be reported to the relevant exchanges at the end of the trading day (on the same day as the deal) and the information must be made public.

    As an online brokerage firm, we understand the nuances of trading, hence offer our best services to our customers, including providing our users with the best trading accounts and lowest brokerage options.

  • Which Is Riskier: Trading Futures Or Trading Options?

    Futures vs options trading always seem to be up for discussion. Traders talk and talk about whether futures or options are riskier. In any case, it’s important to think about how much risk you can handle before you take a side in the ongoing debate. Also, once you know exactly what futures and options are, it will be clear which one has more risks than the other.

    Trading is a risky business, that’s why you should try with new-age technology. We at Zebu, a share trading company offer our customers the best online trading platform to help with their online stock trading journey.

    A Brief Explanation of Options

    A contract between a buyer and a seller is an option. It gives the owner the right, but not the obligation, to buy or sell an asset at an agreed-upon price within a certain time frame. Options are contracts that are parts of a larger group of financial instruments called derivatives. They can be used on indices, stocks, and exchange-traded funds (ETFs).

    On the stock market today, options get their value from the underlying securities, such as stocks. When you trade stocks, all you are doing is trading ownership in a publicly traded company. Options contracts, on the other hand, let you trade the right or obligation to buy or sell any underlying stock. If you own an option, you do not automatically own the thing that the option is based on. Also, it doesn’t give you any rights to dividends.

    Futures: A Short Explanation

    Futures are also contracts or agreements to buy or sell certain stocks or commodities at a certain time in the future. In a futures contract, the buyer and seller agree ahead of time on prices, quantities, and the dates of future deliveries.

    You can either buy or sell in a futures contract. If the price goes up, buyers make money because they bought the asset when it was cheaper. If the prices go down, the people who sold at higher prices will make money.

    A Quick Look at Futures, Options, and Risks

    If you do online trading, you may know some things about how the markets work. For example, if you trade and invest in stocks, you know that you need to open a demat account. In the same way, you would know that futures and options are derivatives if you knew anything about them. They also use leverage, which makes them riskier than trading stocks. Futures and options both get their value from the asset that they are based on. Futures and options contracts make money or lose money based on how the price of the asset they are based on changes.

    There is enough risk in the share market today. Your risk tolerance may be a factor in deciding between futures and options, but it’s a given that futures are riskier than options. Even small changes in the price of an underlying asset can affect trading. This is especially true when trading options. Even though both have the same amount of leverage and capital at risk, futures are riskier because they are more likely to change. You need to know that leverage is like a “two-edged sword.” You can make money quickly and lose it just as fast. In terms of futures, you can make money quickly or lose it in an instant. This is not the case with options trading.

    With options, you can buy either “put” or “call” options while you are trading online. The most you can lose is the amount of money you have put into the options. If your prediction is way off and your options are worthless by the time your contract is up, you may have some bad luck, but you will only lose the premium you pay for the options.

    With futures contracts, on the other hand, you have unlimited liability. You will have to make a margin call to add more money to your account to make up for the daily losses. If you lose money every day, you may have to keep going until the underlying asset stops going against the wind. If you put most of your money into futures contracts and don’t have enough money to cover your margin calls, you could even go into debt. Does all of this sound too risky? You don’t have to worry. Technically, futures are not inherently riskier. Instead, it is the fact that futures can use a higher level of leverage that makes both profits and risks bigger. You can easily borrow money to buy stocks and get 5:1 leverage. With futures, you could get 25:1, 50:1, or even more. So, even the smallest moves can lead to huge profits or huge losses, depending on what was invested.

    Things to think about

    If traders had to choose between trading futures and trading options in the world of online trading, options would be the more interesting choice. In options, the most you can lose is what you put in the first place. Options trading might be the better choice, especially if you use the spread strategies that options give you. If you plan to hold on to trades for a long time, bull call spreads and bear put spreads can increase your chances of success. Futures are riskier because they use a higher level of leverage and a smaller amount of cash to control assets with a higher value. This means that the amount you can lose may be higher than the amount you put in at first. Also, some things about the market could make it hard or even impossible to sell or hedge a certain position.

    Try our new-age technology now! We at Zubu, a share trading company offer our customers the best online trading platform to help with their online stock trading journey.

  • What Is Bottom Fishing?

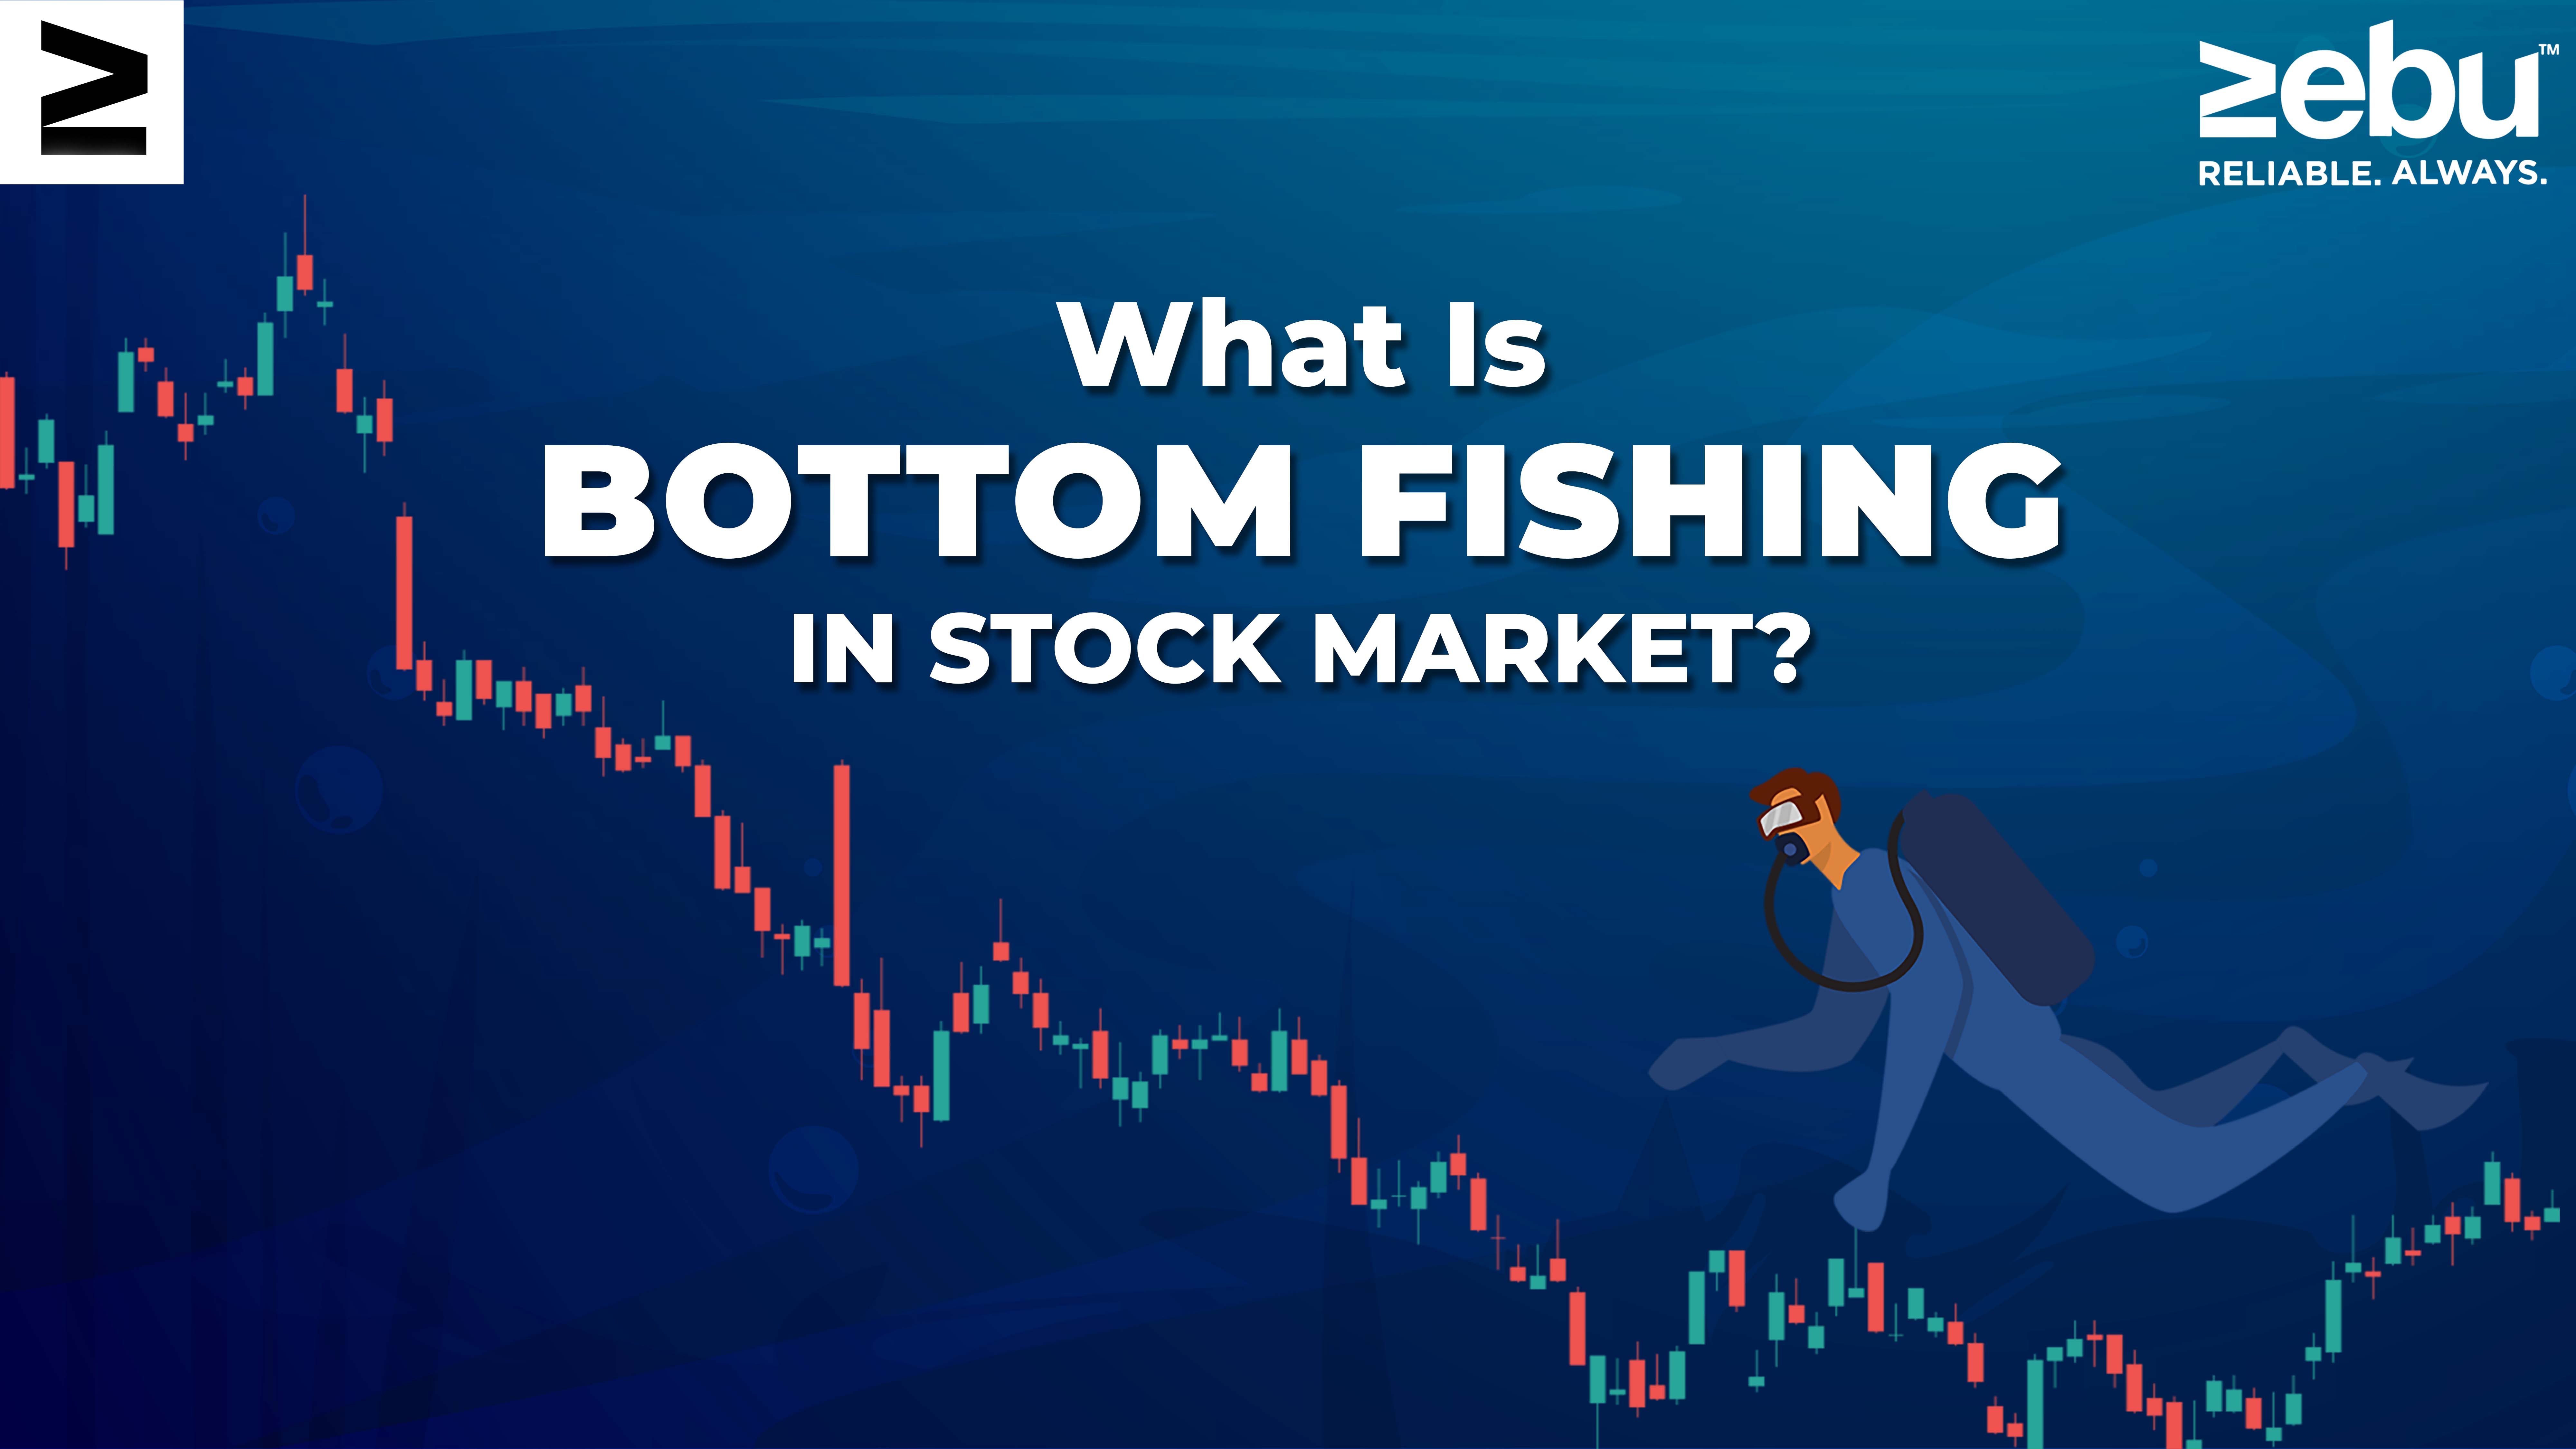
    Bottom fishing is the practice of investing in assets that have gone down in value, either because of internal or external factors and are thought to be undervalued.

    Every move in the share market is critical, but so is the technology you use to make those moves. As an experienced online trading company, we offer our users a seamless online trading platform and the lowest brokerage options to support their trading journey.

    How to Figure Out Bottom Fishing

    Investors who use the bottom-fishing strategy are called “bottom fishers.” They bet, using either technical or fundamental analysis, that an asset’s low price is only temporary and that it will rise again over time to become a profitable investment. Bottom fishing can be a risky strategy when asset prices are down for a good reason or a smart strategy when asset prices are trading at irrationally low prices.

    Bottom fishing is based on the tried-and-true method for making money in the stock market, which is to buy low and sell high. In short, look for value and invest in it. Value investors like Warren Buffett and Benjamin Graham have made a lot of money by buying assets that are selling for less than they are really worth and waiting for prices to go back to normal.

    Bottom fishing as a way to make money has often been thought of as more of an art than a business strategy because it is so abstract. The most important thing to know about this art is that a successful bottom fisher doesn’t try to buy a stock at its absolute lowest price, but rather at a point where it has the best chance of going up.

    The best way to describe the risk of bottom fishing is with the market saying, “There’s a reason why the price is where it is.” Simply put, the market is always deciding how much a security is worth. If the value of a security has dropped sharply, there may be a good reason or reasons for the drop. It is very hard, if not impossible, to tell if this drop is due to something temporary, like panic selling, or if it is a sign of deeper problems that are not obvious.

    Here are some examples of bottom fishing:


    Putting money into the stock of an aluminium company when the price of aluminium is low.
    Buying shares of a company that ships containers during a recession.
    Putting money into a print media company when the internet is driving them out of business.
    Buying shares of a bank when the economy is in trouble.
    In each of these situations, it’s not clear when or if the stock price will go back up, but you could make a case either way. During the 2008 financial crisis, investors who bought bank stocks made a lot of money, but investors in print media companies may have lost money because the industry has never been able to fully recover from the increasing competitive pressures.

    Strategies for bottom fishing
    Bottom fishing is appealing because it has a higher chance of making money than assets that are fairly valued or overvalued. Bottom fishing is most popular in bear markets, which makes sense.

    Value investing is the most common way to fish at the bottom. Value investors look for opportunities where the market may be pricing assets too low. They do this by looking at valuation ratios and predicting future cash flows. A company that had a bad quarter because of a problem with its supply chain and saw a big drop in sales would be a great example. Value investors might decide that this is an isolated incident and buy the stock in the hopes that it will recover and trade at a price that is more in line with its peers.

    Many traders also use technical analysis to find stocks that have been oversold and could be good opportunities for bottom fishing. For example, a company may report quarterly financial results that are worse than expected and see a big drop in price. Traders may see that the pressure to sell is starting to ease and decide to go long to take advantage of the short-term recovery. Often, these traders will use technical indicators that help them figure out if a security has been oversold or look at patterns in candlestick charts to do the same thing.

    As an experienced online trading company, we offer our users a seamless online trading platform and the lowest brokerage options to support their trading journey.

  • What Is All The Hype About A Trading Edge?

    What Is All The Hype About A Trading Edge?

    In theory, a trading edge is a strategy, observation, or special technique that gives a trader an edge over other traders in the market and helps them make more money. There are a lot of books and papers on different trading techniques, but since many people learn and use the same information, the chances that it will give a trader an edge quickly go down to almost nothing.

    Finding an edge and understanding what that really means can help you decide if it’s worth your time to look for one or if it’s even possible or useful.

    The Common Thought

    Most people think that an edge is something that a trader knows or uses that gives them an advantage over the market or all the other traders. For example, a trader might think that using a certain indicator (like the Relative Strength Index, or RSI), in a certain way (like making short trades when the RSI is above 84), gives them an advantage over traders who don’t use the same indicator in the same way.

    Many new traders spend years trying out different indicators or different settings for indicators (like a length of 10, then a length of 15, etc.). They also try out different chart settings, like time-based charts, tick-based charts, or volume-based charts, to find the combination that gives them an edge.

    Getting Your Way

    Some traders have never heard of the term “edge.” When they do, they might start to wonder if they have an edge or if they need to find one. A few rules can help traders find trading edges, if there are any:

    The edge must be based in reality and can’t be based on assumptions. A trader needs to know that an edge might not work all the time. It is possible to make a lot of money with an edge, but then the edge might stop working for a while.

    If you think you have an edge, you should test it by clearly defining the rules and then applying them to historical market data and “paper trading.”

    A wake-up call

    In reality, there are traders who think they have an advantage and traders who think they need an advantage. Some traders laugh every time someone talks about an edge while they make another trade that makes them money. In other words, you might find and use an advantage or you might not.

    Many traders think that good training and instruction give them an edge. In fact, this could be the edge that people looking for an edge are looking for. To trade well, you don’t have to compete with the market or other traders. In fact, the opposite is true. Good risk management and a healthy dose of patience are more likely to lead to success in trading. Retail traders often do better when they focus on controlling their own decision-making processes instead of making decisions based on things they can’t change.

    This is not what many new traders will say. If you are one of them, think about this: Traders who think they have an edge will never tell other traders what trade they are about to make. These traders think that if they talk about it, they might lose their edge.

    Professional traders, on the other hand, won’t think twice about telling other traders what trade they are about to make. This is because it doesn’t change the potential of the trade if other traders know about it or make the same trade.

    Prices can change over time based on supply, demand, and investor sentiment as a whole, but just because one investor thinks they have an edge won’t change anything.

    If you are a new trader who is just starting to look for your edge or if you are an experienced trader who has been looking for your edge for years, you should stop. Markets change so quickly that an edge you find today is likely to be useless tomorrow. In the short term, looking for a trading edge might help you make quick money, but it’s more likely to waste your time and cause you to miss out on opportunities and money.

  • 5 Skills That Every Trader Should Have

    There are many ways to become a professional trader, and a person needs a lot of skills to do well in a field with a lot of stress and competition. When financial firms hire people for trading jobs, they usually look for people with degrees in math, engineering, and hard sciences instead of just people with backgrounds in finance.

    There are also different kinds of trading jobs, some of which require communication skills with customers as well as knowledge of charts. So, let’s take a look at some of the skills that all traders need.

    Skill at analysing

    Every trader needs to be able to look at data quickly and figure out what it means. Trading involves a lot of math, but charts with indicators and patterns from technical analysis show what the data means. So, traders need to improve their analytical skills so they can see trends in the charts.

    Research

    Traders need to have a healthy thirst for information and a desire to find all the important data that affects the securities they trade. Many traders make schedules of economic reports and news that affects the financial markets in a way that can be measured. By keeping up with these sources of information, traders can act on new information while the market is still processing it.

    Focus

    Focus is a skill, and the more traders use it, the better they get at it. Because there is so much financial information out there, traders need to be able to focus on the important, actionable information that will affect their trades.

    Sector-based traders also focus on one particular industry. This helps them learn more about a certain sector, industry, or currency, which gives them an edge over traders who don’t specialise as much.

    Control

    Control and, more specifically, self-control go hand in hand with being able to focus. A trader needs to be able to keep their feelings in check and stick to a plan and strategy for trading. This is especially important when using stop losses or profits at set points to manage risk.

    Many trading strategies are made so that the trader loses less when things go wrong and makes more money when things go right. Strategy goes out the window when traders start to get emotional about their trades, whether they are good or bad.

    Keeping a record

    Keeping good records is one of the most important parts of trading. If a trader keeps careful records of how his or her trades turn out, all that’s left to do to get better is to try out different strategies and change them until one works. If you don’t keep good records, it’s hard to show real progress.

  • How To Keep Your Emotions In Check While Trading

    How To Keep Your Emotions In Check While Trading

    On their way to becoming market masters, stock traders go through different stages. One of the hardest things to learn is how to trade without letting your emotions get in the way. You can be good at picking stocks and managing risk and still fail as a trader if you can’t keep your emotions in check.

    When you know how to control your emotions, you can be patient with your winners and not at all with your losers. Even though it seems easy to say that you should stick to your trading plan, it is actually much harder to do so. Most of us have strong feelings about money, which makes it hard to stick to our rules.

    To do this, you have to take the money out of the picture. Financial risk can’t be a factor in making decisions. It might be hard to incorporate this ideology while trading but you can remove the emotions from trading only if you are able to get this right.

    Here are some ways to trade without letting your emotions get in the way:

    1. Don’t put yourself in more risk than you can handle.

    Most traders keep their losers too long and sell their winners too soon because they take on too much risk. Taking on too much risk ties down your risk management, making it harder for you to make trades with a positive expected value.

    This is something you can change by taking less risk. Then, many traders find that the upside isn’t enough to make them want to trade at all. If a trader doesn’t have a way to make good profits with the money they have, they may start to take on more risk to try to get better results.

    But you can make your trades more likely to go up without taking on more risk if you scale into your positions. As the trade goes in your favour, add to your winners. You don’t need to put yourself in danger by doing this. You can lower the risk of your other positions by using the money you made from your first positions. Add to the list of winners. Don’t throw money at your losers.

    2. Change how you think about money

    We often tell people that it’s best not to look at the summary of their trades’ profits and losses. When you do this, you get too caught up in the current gain or loss on your positions, which makes your fear or greed about the trade worse. Instead of making decisions based on the chart, think about the money.

    People can’t be expected to trade without checking to see if they are making or losing money. So, if you have to look at your trades, instead of focusing on how much money you are making or losing right now, think about how much money you will make or lose if your trade hits the stop loss levels.

    If you buy 1,000 shares of a stock for Rs 100 and the stop is at Rs 90, you could lose Rs 10,000. That’s how much you could lose when you leave.

    Let’s say that this stock goes up to Rs 120 and you move your stop to Rs 110. Even though your position is up Rs 20,000 right now, if you get out on the stop, you will only make Rs 10,000. You need to pay attention to the number that matches your exit point. Don’t think too much about where you are now.

    If you congratulate yourself on making Rs 20,000 on a trade, you start to feel something about that number. If so, you are less likely to sell the stock if it goes back down to Rs 110, where you would only make Rs 10,000. You thought you would make Rs 20,000 and hoped it would be more. It hurts to leave at a lower price, so many people stay and wait for things to turn around. Count on what you already have, not what you want.

    3. Make a plan on paper and trade it

    Some people can lose their minds because of how they feel about a trade. When you make a trade, your feelings can make you break your trading rules. Having a plan written down will help you stay on track when you get lost.

    The plan doesn’t need to be long or hard to understand. A trading plan shouldn’t be longer than one page, in our opinion. It should include your rules for entry, risk management, scaling, and leaving the business. There should also be a review process so that you can work to make your rules and how they are carried out better.

    When you write down an idea, it gives it more value. Before you make another trade, take the time to write out a plan.

  • Ideal Timeframe For Intraday Trading

    Intraday trading often proves that taking fewer trades gives you better profits. Instead of buying and selling stocks the whole trading day, it might be smart to do intraday trading only during a few key hours. In fact, traders who work with stocks, index futures, and ETFs have found that it’s better to spend one to two carefully chosen hours a day on trading.

    The ideal time-frame for intraday trading

    Long-term intraday traders will do well to find the best time frame. Using these hours can help you get the most done because they are when important things happen on the market. On the other hand, people who trade all day have little time for other things and don’t make enough money. Even intraday traders who have been doing it for a long time can lose money if they trade outside of the best time frame for intraday trading. This raises the question: what is the best time frame for intraday trading? Most say that it is between 9:30 and 10:30 in the morning.

    Should you buy or sell within the first 15 minutes?

    Intraday trading is best done in the first one to two hours that the stock market is open. But in India, most stock market trading channels don’t open until 9:15 a.m. Why not start at 9:15 instead? If you have been trading for a long time, trading in the first 15 minutes might not be as risky. For people who are just starting out, it’s best to wait until 9:30. This is because, in the first few minutes after the market opens, stocks are probably reacting to the news from the night before.

    A trade will often show sharp price movements in one direction. This is nicknamed the “dumb money phenomenon” because people rely on old news. Traders with a lot of experience may make some good deals in the first 15 minutes. They are mostly mean reversal traders. Beginners who have never heard of “dumb money” or the strategy that experienced traders use to fight against it will think the market is very volatile. So, it’s better to wait until 9:30 than to jump in at 9:15.

    Trading at the open

    Not all moves are bad. After these first extreme trades, the market will have the right amount of volatility for beginners. Since this is the case, the best time to trade is between 9:30 am and 10:30 am. There are many benefits to intraday trading in the first few hours after the market opens:

    The first hour of the day is usually the most volatile, giving you plenty of chances to make the best trades of the day. The market is liquid enough to get in and out of during the first hour. Since there is more volume, liquid stocks are likely to be sold off faster.
    – It has been shown that the stocks bought or sold in the first hour make some of the biggest moves of the whole trading day. If you do it right, it can give you the best returns of any time during the trading day. But you should also prepare for large losses in the first hour due to volatility.
    – After 11 a.m., trades usually take longer and involve fewer people, which is bad for intraday traders who need to finish their deals by 3:30 p.m. If you need more time, it would be a good idea to keep this session going until 11 a.m. But day trading is a better fit for the strategy of only trading in the first hour.

    Think about the bigger picture.
    The range of 9:30 to 10:30 is not a rule that every trader must follow. It’s good for beginners in general, but you can change it to fit your needs. It’s smart to think about the bigger picture.

    For example, one strategy for intraday trading is to keep the day of the week in mind along with the best time frame. Monday afternoon is often a good time to buy on the market because prices tend to go down at the beginning of the trading week. Experts say that you should sell on Fridays, right before the drop on Monday.

    Also, not every trader needs to do something during that first hour. People who usually make more than one trade in a day can choose a shorter time frame. Intraday traders who only make a few trades each day can choose a longer time frame instead. Traders with a lot of experience may also change their time frame on different days, depending on how busy they are.

  • What Should You Look For In A Company’s Quarterly Reports?

    Experts say that reading a company’s quarterly earnings is an art that must be honed over time with careful and deliberate work. A company’s quarterly earnings report is like an internal compass that shows how it is doing now and how it will do in the future. It also helps figure out how much the company is worth. Still, many regular investors still don’t understand how a company’s quarterly earnings work. How to read a company’s quarterly results? What can you tell about the company from these results? Why do companies even bother to report their quarterly results?

    Security and Exchange Board of India (SEBI) rules say that every listed company must make its quarterly reports public. This is to protect the interests of investors.

    As an investor in a company, the quarterly results will help you figure out how the company is doing now and how it will do in the future. You can also tell from the quarterly result if you should invest in the company for the long term. The quarterly results of a big company could have a direct effect on the market for short-term investors or intraday traders. When a big company announces its quarterly results, the markets go up or down depending on the effect.

    How can you read results for a quarter?

    If you are a beginner you can focus on three main parameters of the report. These are the sales growth, debt to equity ratio and promoter holding. WIth an increasing sales growth and a high promoter holding, you can know that the company is doing well. Debt to equity ratio tells you whether the company has incurred more debt compared to the previous quarter.

    Gross sales

    Gross sales is the total amount of money a business makes in a certain amount of time. Gross sales that keep going up over time are a sign of growing demand and a healthy business.

    Net sales

    Gross sales minus discounts, returns, and allowances equal a company’s net sales. When putting together the top-line revenues and the statement of income, net sales are often taken into account. This is a better measure of the health of a business than gross sales.

    Expenses and income

    Operating income is the amount of profit made by a business after operating costs like wages, depreciation, and the cost of goods sold are taken out. It shows how much money the company is making.

    On the other hand, other-than-business income is income from sources other than the business. It includes, among other things, dividends and rental income.

    A steady drop in operating income could mean that the company is losing market share or that fewer people want to buy its goods or services.

    Things to think about when writing quarterly reports
    Interest cost
    To run a business, the interest cost is the money paid for a loan amount. So, if the cost of interest goes up, it means that the company has more debt.

    What else should you look for in a quarterly earnings report?
    Investors should also look at things like net interest margins and non-performing assets when it comes to banks. Experts say that investors should also look at how much cash the company has on hand and how many shares have been pledged. Not every company may be declaring their pledged shares every three months. Investors should also look at the asset-liability statement, which shows half of the financial year when they look at the results for the next quarter.

    Why should investors pay attention to news about earnings?
    Earnings reports are often one of the most important things that move stocks. When big stocks report earnings, they can shake the market. When the earnings reports come out, the stock market could be at a record high or a record low.

    When a company’s sales go up but it doesn’t meet the analysts’ expectations, people will sell their shares quickly. So, the report’s estimates are also just as important as the report itself.

    Before analysing the quarterly reports, make sure to compare them with the previous year’s audited report as well. This will help you with understanding the projections for the upcoming quarter as well.

  • What Exactly Are VAR And SPAN Margins?

    VaR and SPAN margins are related to every position you take in the stock market, especially if you trade in FnOs. But what exactly are they and how can you calculate them?

    Here’s everything you need to know.

    VaR is a way to measure the risk of a loss. Value-at-risk, or VaR, is a way to measure the downside risk or potential loss of a portfolio or investment over a certain amount of time. It helps analyse and estimate how much the minimum loss can be with a certain amount of confidence. Essentially, it is a number that tells you how risky a portfolio is.

    For example, VaR can tell us that an investor can expect to lose at least 2% of the total value of their portfolio on 1 out of every 15 days. So, it helps figure out how much money could be lost, how likely it is to lose that much money, and how long it could take.

    Statistical simulations can be used in a number of ways to figure out VaR. The risk management department of a company keeps a close eye on this parameter and tries to make sure that extremely risky trades are not taken.

    Margin SPAN

    On the equity markets, traders also need to have a certain amount of money set aside as “margin money” to help cover trade losses. But it is hard to guess how much of a margin is needed to cover all the losses if the market shows the worst-case scenario. As a result, the SPAN, which stands for Standardised Portfolio Analysis of Risk, is a standard way for traders to figure out how much margin money they need.

    When figuring out margin amounts for every single position, the SPAN system uses complicated algorithms and machine learning techniques. Each margin amount is equal to the most a single account can reasonably lose in a single trading day. It was made by the CME in 1988, and more than 50 exchanges around the world use SPAN as their official way to figure out how much margin they need. This margin is different for each security because each one comes with a different level of risk. For example, the SPAN margin for a single stock will be higher than that for an Index because single stocks are more risky and volatile.

    Risk management

    Every trader who is successful knows how important it is to manage risk, which is even more important than making money. With the help of VaR and SPAN calculations, a trader can keep a large number of contracts in their portfolio and stay away from serious margin calls.

    More brokers and financial institutions are now focusing on better ways to handle risks. Many of them require that, in addition to SPAN margin, which is collected when trades are started, an additional margin called Exposure margin to be collected to protect against liabilities caused by wild swings, rogue trades, or reactions to extreme stress in the market.

  • The Basic Rules Of Day Trading You Should Know

    Day trading is a way to trade stocks that is both risky and profitable. Day trading, which is also called intraday trading, is when you buy and sell stocks during the same trading session. Here are some basic intraday trading tips you can use if you want to use this strategy to make money on the stock market.

    Before we get into the rules, the basic rule of trading is to use the right tools — as a share trading company we understand this better than anyone and are here to offer our customers the best Indian trading platform along with the lowest brokerage options.

    1. Choose the best stocks

    When you start day trading, the first and most important thing you should do is choose the right stock to buy. Not all stocks are good choices for trading during the day. Since you would be buying and selling them during the same trading session, you would need to choose stocks with a lot of liquidity, which will make buying and selling them easier. Large-cap stocks and mid-cap stocks are usually the best choices for day trading because they have a lot of buyers and sellers.

    2. Set prices to enter and exit the market

    Once you’ve decided on the stock you want to trade, the next step is to set entry and exit prices. Going into a trade without any goals is a sure way to lose money. Set a price at which you want to buy the stock and stick to it, even if it means you might not be able to buy it. Set a goal for when you want to sell the stock, even if it means you might miss out on any gains the stock might make in the future.

    3. Don’t forget to set stop loss
    After buying the stock, the first thing you should do is set a stop loss. This will keep you from losing a lot of money if the stock moves in a way you didn’t expect. Let’s say you buy a stock for Rs. 100 with the hope that it will go up. But as a safety net, you set a stop loss at Rs. 97. Now, if the stock goes against your expectations and drops to Rs. 97, the stop loss will be triggered, and your stock will be sold at a loss of Rs. 3. You will also be protected if the price goes down even more.

    4. Always follow the trend

    This is one of the best tips you can use when trading during the day. If the market is going up, it’s a good idea to buy stocks. And if it is bad, it is best to sell stocks. Contrarian views on the market are never a good idea because they can backfire. For example, many people short-sell stocks when the market is bullish because they expect the price to go down. These kinds of changes don’t happen very often.

    Conclusion

    Even though intraday trading is riskier than regular trading, when done right, it can be one of the most profitable ways to make money consistently. So, if you want to do day trading, you must have both a trading account and a Demat account. Get in touch with us right away to start trading stocks.

    As a share trading company, we understand this better than anyone and are here to offer our customers the best Indian trading platform along with the lowest brokerage options. Want to try out our tools? Get in touch with us.