Category: Trading

  • Benefits Of Trading In Index Futures


    Title Page Separator Site title

    A futures contract on a sectoral or market-wide index is called an index future. On the NSE, for example, you can buy futures on the Nifty, which is a market-wide index, and liquid futures on the Bank Nifty (which is a sectoral index of liquid banks). Both of these indices are very liquid, and both individual and institutional investors trade them a lot. Why have index futures in India become so popular? Why would you want to trade in index futures? Index futures trading in India grew out of stock futures trading, which was similar to the old Badla system on the BSE. In addition to looking at how to trade index futures, let’s look at how traders can actually benefit from doing so.

    As one of the top brokers in the share market we understand the concerns with brokerage fees and offer lowest brokerage for intraday trading and the best trading accounts for our users.
    1. You can look at the whole and avoid stock risk

    Let’s say you’ve decided to buy banking stocks, but it will be hard to figure out which ones to buy. While NPAs may be a problem for PSU banks, valuations are a problem for private banks. A better idea would be to look at the whole banking industry, which will give you a natural way to diversify. You can do this by buying Bank Nifty Futures and taking part in the rise of banks. The benefit is that you can keep your position open as long as you want by rolling it over each month for a small fee of about 0.50 percent.

    2. You can trade in both long and short directions

    It’s fine if you’re betting that banking stocks will do well. But what if you think banks are bad? If you own banking stocks, you can sell them or sell them short on equity markets. But because Indian markets use rolling settlements, you can only short stocks for one day. The other option is to sell stock futures of certain banks, but this also comes with risks related to those banks. All of these problems can be solved by selling the index futures for Bank Nifty. If you think the Indian markets as a whole will go down, you can just sell Nifty futures.

    3. The margins for trading index futures are lower

    Always keep in mind that trading in futures is all about trading on margins. But the margins on indices like the Nifty and the Bank Nifty tend to be lower than the margins on individual stocks. Because an index is a group of stocks, it offers a natural way to spread out risk. This is shown by the fact that less risk is needed to take a position in index futures. This will make sure that the amount of money that is locked in is also less.

    4. With index futures, you can reduce your risk

    This is a very important part of how you manage your portfolio. Whether you invest on your own or through a company, you may have a large portfolio of stocks. Once the US Fed raises rates, you think the market will fall. At the same time, you are sure that the drop in your stock prices will not last long and that they will go back up in the next few months. You could just keep your portfolio, but it would be better to sell Nifty futures to spread out your risk. When the market goes down, you make money on Nifty futures, and these profits will help you lower your average cost of holding equity. After 3 months, you will definitely be better off.

    5. Very liquid
    There are often problems with the way certain stocks or stock futures trade. On the other hand, index futures rarely face liquidity risk because institutional investors like to use them. Because of this, the bid-ask spreads are also very small. This makes it pretty safe to trade in these index futures, since you won’t get stuck for lack of liquidity. This is one of the main reasons why trading index futures is good.

    6. Index futures can help you diversify

    If you have a portfolio that is mostly geared toward financial stocks and you think there is some risk because RBI is raising interest rates, so you want to add safety by investing in non-cyclical sectors like FMCG and IT. Buying these stocks is one option, but it will cost money and lock up funds if the opportunity is only for a short time. A better way is to add index futures for the FMCG index and the IT index to your portfolio. This will help you diversify your portfolio’s structure with little risk and money.

    7. It costs much less to trade index futures.

    Index futures have much lower commission rates and STT rates than equities or even stock futures. In fact, most brokers will also offer you fixed brokerage packages on indices, which makes them cheaper than stock futures as well. Make the most of the fact that index futures cost less. This is why index futures are a great way to trade with less risk and a higher chance of making money.

    As we mentioned earlier as one of the top brokers in the share market we understand the concerns with brokerage fees and offer lowest brokerage for intraday trading and the best trading accounts for our users.

  • How To Make Sense Of A Company’s Earnings Report

    When you look at a company’s financial report, the words “earnings” and “profit” jump out at you. Which profit should you look at when judging a business? Why do we need so many ways to measure profit? How do analysts figure out the ratios they keep talking about?

    Here is a quick breakdown of the important terms of an earnings report.

    Before getting to understand a company’s earnings report, we would like to inform you that at Zebu, an online stock broker company we offer lowest brokerage for intraday trading and the best online trading platforms.

    1. Gross profit

    What it is: Sales minus the cost of making those sales. To figure out the cost of goods sold, you add the purchases made during the period to the net stock.
    The meaning: Not the company’s total income because it doesn’t count “other income” like rent.

    2. EBITDA

    What it is: Earnings before interest, taxes, depreciation, and amortisation. To figure out net profit, take gross profit and subtract operating, general, administrative, and selling costs.
    The meaning: Not a true picture of how profitable a company is because it includes taxes and interest payments, which can be very high for some companies.

    3. EBIT

    What it is: Income before interest and taxes are taken out. Operating profit is another name for it. Depreciation and amortisation costs are subtracted from EBITDA to get this number.
    The meaning: This shows how much money the company makes from its main business.

    4. EBT

    What it means: Income before taxes. Interest costs are subtracted from EBIT to get this number.
    What it means is that tax deductions are different for each company. EBT makes it easy to compare how companies use loans to increase their return per share because it includes taxes but not interest.

    5. NET PROFIT

    How it works: Calculated by taking the tax out of the EBT. Also called net profit (PAT).
    The meaning: Since all payments have been made, it shows how much the company made in the end. PAT is used to figure out the dividends.

    6. EPS

    This is the earnings per share. This number is found by dividing PAT by the number of shares in circulation.
    The meaning: It shows how much each share of a company is making. When calculating EPS, dividends on preference shares are not taken into account.

    7. P/E

    How it works: Divide the current share price on the market by the earnings per share to get this number.
    The meaning: This shows how much an investor is willing to pay for one rupee of a company’s earnings. Analysts use it to figure out if a company is undervalued or overvalued.

    8. Operating ratio

    It is figured out by dividing operating costs by net sales (revenue). It shows how much of the income goes toward operating costs. The lower the ratio is, the better the company is. This shows that the company has enough cash on hand to grow and pay interest.

    9. Net profit ratio

    It’s PAT divided by net sales. This shows how much money a company makes on every Rs 100 sale. If the ratio is high, it means that the company is making a lot of money.

    10. Debt-equity ratio

    It shows how financially stable a company is and is found by dividing debt by equity. If the ratio is less than one, the company is using more of its own money and less debt. If the ratio is more than one, the company is using more debt than its own money. Since interest costs are fixed, a company with earnings that change a lot can take a risk by having a lot of debt. Companies that make a lot of money can increase the returns for equity shareholders by taking on a lot of debt.

    These are the key terms that you should keep in mind while analysing a company’s performance.

    At Zebu, an online stock broker company we offer lowest brokerage for intraday trading and the best online trading platforms.

  • Things To Do Before Becoming A Trader

    When it comes to investing, stock trading gives more weight to short-term profits than long-term ones. It can be dangerous to jump in without knowing what to do.

    How do you trade stocks?

    When you trade stocks, you buy and sell shares of companies to make money off of daily price changes. Traders keep a close eye on these stocks’ short-term price changes and then try to buy low and sell high.
    Traditional stock market investors tend to be in it for the long term, while stock traders focus on the short term.

    If you trade individual stocks at the right time, you can make quick money, but you also risk losing a lot of money. The fortunes of a single company can rise faster than the market as a whole, but they can also fall just as quickly.

    If you have the money and want to learn how to trade, you can trade stocks quickly from your computer or phone thanks to online brokerages.

    Ways to trade stocks

    There are two main ways to trade stocks:
    When an investor makes 10 or more trades per month, this is called “active trading.” Most of the time, they use a strategy that depends heavily on timing the market. They try to make money in the coming weeks or months by taking advantage of short-term events (at the company level or based on market fluctuations) like results, RBI policies and global economic events.

    Day trading is the strategy used by investors who buy, sell, and close their positions in the same stock all on the same trading day. They don’t care much about how the businesses they’re investing in work. The goal of a day trader is to make some money in the next few minutes, hours, or days by taking advantage of price changes that happen every day.

    How to buy and sell stock
    If you’re new to trading stocks, you should know that most investors do best by keeping things simple and putting their money in a mix of low-cost index funds. This is the key to long-term outperformance.

    So, if you want to trade stocks, you need to do five things:

    1. Get a trading account

    To trade stocks, you need to put money into a brokerage account, which is a special kind of account made for holding investments. You can open an account with Zebu in just a few minutes if you don’t already have one. But don’t worry, just because you open an account, you’re not investing your money yet. It just lets you know that you can do it when you’re ready.

    2. Set a stock trading budget

    Even if you’re good at trading stocks, putting more than 10% of your portfolio in a single stock can make your savings too vulnerable to changes.

    If you want to start investing, you could start by putting away Rs 2,000 a month. When you have Rs 2,000, you could put Rs 500 into an investment. Think of the Rs 500 you don’t invest as a parachute. It might not be necessary, but it’s there just in case. Other things to do and not to do are:

    Trade with the money that you can afford to lose.

    Don’t spend money that you need to use soon for things like a down payment or school.

    Cut that 10 percent if you don’t have a good emergency fund and aren’t putting 10 to 15 percent of your income into a retirement account.

    .3. Figure out how to use market orders and stop orders

    Once you have a brokerage account with Zebu and a budget, you can use the website or trading platform to buy and sell stocks. You’ll be given a number of order types to choose from, which will decide how your trade goes. In our guide on how to buy stocks, we explain these in more detail, but here are the two most common types:

    Market order: The stock is bought or sold as soon as possible at the best price.

    Limit order: Buys or sells the stock only at a price you set or higher. For a buy order, the limit price is the most you’re willing to pay, and the order will only go through if the stock’s price falls to or below that amount.

    4. Use a “paper trading account” to get some practice

    Try investing in the market without putting any money in it yet to see how it works.

    Choose a stock and keep an eye on it for three to six months to see how it does. You can also learn about the market with the help of tools like online paper trading. Customers can test their trading skills and build a track record with stock market simulators before putting real money on the line.

    5. Use a good benchmark to measure your returns

    This is important advice for all investors, not just those who are very active. When picking stocks, the main goal is to beat a benchmark index. That could be the Nifty 50 index, which is often used as a stand-in for “the market,” the Sensex, or other smaller indexes made up of companies based on size, industry, and location.

    Measuring results is very important, and if a serious investor can’t beat the benchmark, which is hard for even professional investors to do, it makes financial sense to invest in a low-cost index mutual fund or ETF, which is basically a basket of stocks whose performance is close to that of one of the benchmark indexes.

    And these are the basic dos and don’ts for beginner traders. Stay tuned for more on this subject.

  • Types Of Stocks In The Indian Share Market – Part 2

    In the previous blog, we discussed a few important types of stocks. Now, let’s look at the other major categories.

    5. Value Stocks

    These are stocks that are trading below their worth or intrinsic value. What exactly is intrinsic value?

    It is the true worth of the company based on estimates rather than the market price of the company’s stocks.

    Consider the following example:

    Assume you come across a firm called Sheetal Communications, which has a current share price of Rs. 500. However, based on your calculations, the company’s intrinsic value is Rs. 600 per share. The stock market will eventually recognise the company’s true worth, and the stock will grow correspondingly.

    Value stocks are inexpensive and have the potential to generate high returns over time.

    However, both value companies and terrible stocks are available at a low valuation.

    So how do you tell the difference between the two?

    Remember that value stocks are quality businesses that have been momentarily trading at lower prices and have the ability to resurge and prosper in the future. Some possible reasons for a temporary decline include results falling short of expectations for a quarter, a brief piece of bad news riding strong sentiment but with a smaller financial impact, or simply poor market mood. Weak stocks, on the other hand, have limited liquidity, inconsistent earnings history, or poor metrics on conventional financial parameters.

    6. Growth Stocks

    You might have guessed how stocks in this category work. These are companies whose earnings are expanding faster than those of their peer group.

    However, because of their stronger growth rate, these stocks require a higher investment than their rivals. They require additional capital to expand due to their rapid growth. As a result, these stocks will pay no or very little dividends and will reinvest earnings largely in the firm.

    However, the difficulty with these stocks is that a company’s rapid growth rate does not usually last long. This means that when the company’s growth rate returns to normal, the stock price may decline with it.

    7. GARP Stocks

    GARP, or Growth at Reasonable Price, is a hybrid of growth and value investment. GARP investing identifies growth stocks that are accessible at a reasonable valuation.

    The goal is to find growth firms that consistently exhibit above-average earnings growth while trading at a low value. These equities have an average P/E ratio and a greater rate of earnings growth, resulting in a PEG ratio of one or less than one.

    However, there is a distinction between GARP and value investing.

    Value investors seek out stocks that are inexpensive, but the chance of losing money with GARP is negligible.

    8. Momentum Stocks

    Momentum stocks are based on the idea that if a stock is rising, it will continue to rise for some time. This means that investors would buy rising stocks and sell them when they appear to have peaked.

    It is usual for investors to buy up-trend momentum equities at greater prices with the hope of selling at even higher prices. Early riders on the momentum rally benefit the most.

    However, momentum can be a trap for new investors if they enter the stock too late, especially if the up-move is about to end.

    When a stock begins to rise in price, investors become concerned that they will miss the next major move and begin to buy. This causes the stock to rise even higher, and so on.

    Momentum investing is based on technical information rather than fundamentals. And, while momentum investing may not be a good option for inexperienced investors, when done correctly, it can result in remarkable profits.

    9. Income stocks

    These investors want a steady income with the possibility of capital appreciation. Income stocks are less risky than other equities in the market. Companies in the income stock category receive extra income in the form of dividends that the company pays per share.

  • Three Of The Most Commonly Used Pullback Strategies

    Are you aware that one of the most fundamental trading methods is to trade trend pullbacks? Yes! There are numerous strategies to earn from pullback trading.

    You may profit from trading pullbacks across all time frames. This is because a trend can occur on any time scale, from the 5-minute to the monthly.

    Before we get into commonly used pullback strategies we would like you to know that at Zebu, one of the fastest-growing brokerage firms in the country, we have created the best Indian trading platform with the lowest brokerage for intraday trading.


    In today’s blog, we’ll present six profitable pullback trading strategies, but first, let’s define pullback trading:

    What does the term “Pullback Trading” mean?

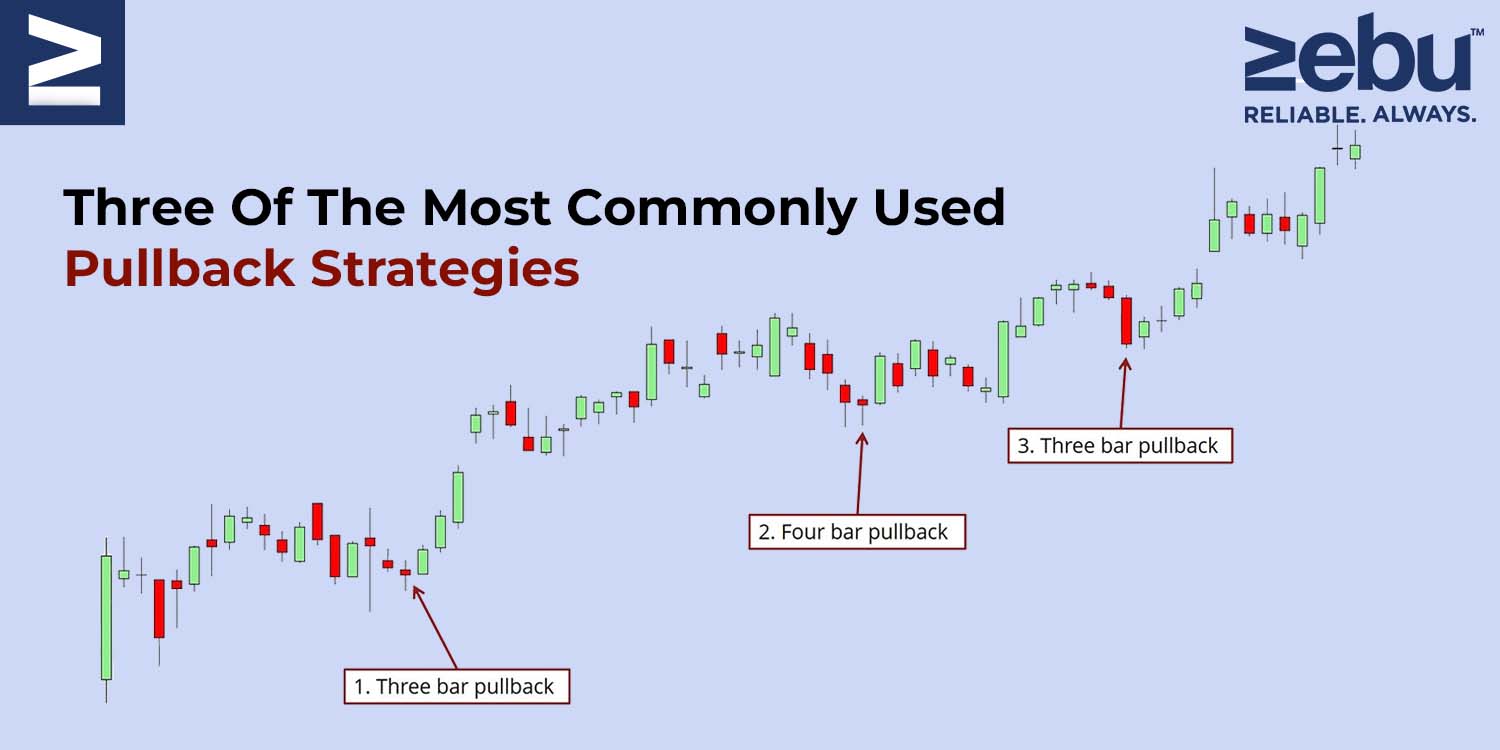
    A pullback is a temporary halt or little decline in the price of a stock or commodity that occurs during an ongoing increase.

    A pullback is virtually synonymous with retracement or consolidation. The term “pullback” refers to brief price drops – say, a few consecutive sessions – before the uptrend resumes.

    Following a significant upward price movement, pullbacks are sometimes considered as buying opportunities.

    For instance, following a great earnings report, a stock may have a significant jump before reversing as traders liquidate existing positions. On the other side, positive earnings are a fundamental indicator that the stock will continue to climb.

    Most pullbacks see a security’s price move to a technical support level, such as a moving average or pivot point, before resuming its uptrend. Traders should pay special attention to these important support levels, as a breach below them may indicate a reversal rather than a retreat.

    Now that we understand what pullback trading is, let us explore several tactics for trading pullbacks:

    1. Pullback to a trendline
    Determining the trend’s direction should be quite straightforward. The swing high and low structure is the most straightforward way to recognise a trend.

    An uptrend is defined by a series of higher highs followed by a series of higher lows. Whereas a downtrend is defined by a series of lower lows and lower highs.

    The disadvantage is that trendlines are frequently validated more slowly. Three contact points are required to validate a trendline. You can always link two random locations, but it is only when you reach the third that you have a true trendline.

    As a result, traders can only trade the trendline pullback at the third, fourth, or fifth contact point.

    While trendlines perform well in conjunction with other pullback tactics, as a stand-alone strategy, the trader may miss numerous opportunities if trendline validation takes an extended period of time.

    2. Pullback to moving average

    Without a question, moving averages are one of the most often utilised tools in technical analysis, and they may be used in a variety of ways. Additionally, you can utilise them to trade pullbacks.

    A moving average of 20, 50, or even 100 periods could be used. It is irrelevant because it is entirely dependent on whether you are a short-term or long-term trader.

    Shorter-term traders utilise shorter moving averages to get hints more quickly. Naturally, shorter moving averages are more prone to noise and false signals.

    On the other side, longer-term moving averages move more slowly and are less subject to noise, but may miss short-term trading opportunities. Consider the advantages and downsides for your own trading.

    3. Pullback after a breakout

    Breakout pullbacks are extremely prevalent, and probably the majority of traders trade this price action pattern.

    Pullbacks following breakouts are frequently seen at market turning points, following the price breakout of a consolidation pattern. The most often used consolidation patterns are wedges, triangles, and rectangles.

    Open range breakout is another common strategy. Once the day’s 15 minutes low and high are marked, traders enter a long position once the upper limit is broken on a good volume. In this situation, it would be ideal to wait for a pullback to the vwap or the 15-minute high for a better risk:reward potential.

    As we mentioned before, trading and investments requires the best Indian trading platform and the lowest brokerage for intraday trading.. As one of the best brokerage firms in the country, we have created a powerful trading platform that makes analysis easy for you. To know more about its features, please get in touch with us now

  • Everything You Should Know About Elliot Waves

    In the 1930s, Ralph Nelson Elliott established the Elliott Wave Theory. Elliott argued that stock markets, which are widely assumed to function randomly and chaotically, traded in repeating patterns.

    In this article, we’ll go over seven crucial things that you should know about Elliot Waves. But before we get into that you need to understand that investment is also about choosing the right technologies. As one of the top brokers in share market, we at Zebu offer trading accounts with lowest brokerage, and an online trading platform to help you focus only on executing your strategies efficiently.


    We’ll look at the history of Elliott Wave Theory and how it’s applied to trading in this post.

    Waves

    Elliott suggested that financial market patterns are determined by investors’ dominating psychology. He discovered that swings in popular psychology usually manifested themselves in predictable fractal patterns, or “waves,” in financial markets.

    Market Forecasts Using Wave Patterns

    Elliott made precise stock market predictions based on reliable wave pattern qualities he found. An impulse wave always exhibits a five-wave pattern because it travels in the same direction as the broader trend. On the other hand, a corrective wave net travels in the opposite direction of the main trend. On a smaller scale, five waves can be detected within each of the impulsive waves.

    Interpretation of the Elliott Wave Theory

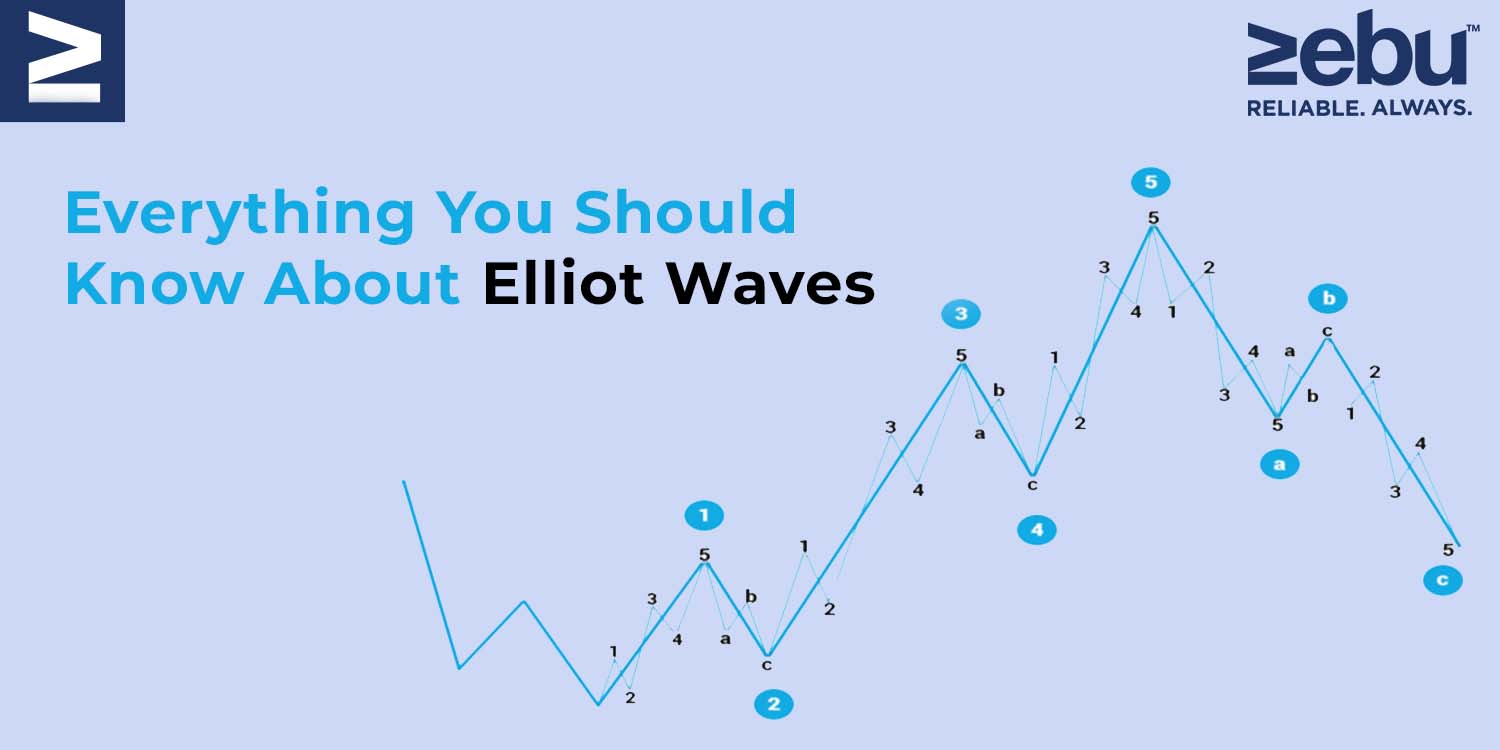
    Five waves advance in the direction of the primary trend, followed by three waves in the direction of the corrective (totalling a 5-3 move). This 5-3 move is then subdivided into two subdivisions of the following upper wave move.

    While the underlying 5-3 pattern remains consistent, the duration of each wave varies.

    Consider the following chart, which contains eight waves (five net upward and three net downward) labelled 1, 2, 3, 4, 5, A, B, and C.


    The impulse is formed by waves 1, 2, 3, 4, and 5, whereas the correction is formed by waves A, B, and C. The five-wave impulse, in turn, generates wave 1 at the next-largest degree, while the three-wave correction generates wave 2.

    Normally, a corrective wave consists of three independent price movements – two in the direction of the primary correction (A and C) and one in the opposite direction (B). Correction waves 2 and 4 are depicted above. Typically, these waves have the following structure:

    Take note that waves A and C in this illustration move in the direction of the trend at a greater degree, indicating that they are impulsive and composed of five waves. By contrast, Wave B is anti-trend and thus corrective, consisting of three waves.

    When an impulse wave is followed by a corrective wave, an Elliott wave degree containing trends and countertrends is formed.

    As illustrated in the patterns above, five waves do not always go in a net upward direction, and three waves do not always travel in a net downward direction. When the larger-degree trend is downward, for example, the five-wave sequence is downward as well.

    To apply the idea in daily trading, a trader may spot an upward-trending impulse wave, take a long position, and then sell or short the position when the pattern reaches five waves indicating a reversal is likely.

    The Verdict

    Elliott Wave practitioners highlight that just because a market is fractal does not automatically make it predictable. While scientists recognise a tree as a fractal, this does not indicate that the route of each of its branches can be predicted. In terms of practical application, the Elliott Wave Principle, like all other analysis methodologies, has its supporters and critics.

    One of the critical flaws is that practitioners can always blame their chart reading rather than flaws in the theory. Alternatively, there is an open-ended understanding of the duration of a wave.

    As we mentioned before investment is also about choosing the right technologies. As one of the top brokers in share market, we at Zebu offer trading accounts with lowest brokerage, and an online trading platform to help you focus only on executing your strategies efficiently.

  • Five Market Theories You Should Know About

    When it comes to investing, there are several theories on what makes markets tick and what a given market move indicates. The two major Wall Street factions are divided along theoretical lines: those who believe in the efficient market theory and those who believe the market can be defeated. Although this is a basic distinction, other theories attempt to explain and affect the market, as well as investment behaviour.

    If you are interested in investing or trading, then consider Zebu to get started, as a reputed share broker company we offer lowest brokerage options and a seamless online trading platform to help you with your investment journey.


    1. Theorem of Efficient Markets

    The efficient markets hypothesis (EMH) continues to be a point of contention. According to the EMH, the market price of a stock integrates all available information about that stock. This signifies that the stock is priced appropriately until a future event alters the price. Given the uncertainty of the future, a devotee of EMH is significantly better suited to owning a diverse range of companies and gaining from the market’s overall increase. You either believe in it and employ passive, wide market investment strategies, or you dislike it and concentrate on stocks with high growth potential, undervalued assets, and so on.

    Those who oppose EMH refer to Warren Buffett and other investors who have repeatedly outperformed the market by identifying irrational pricing inside the broader market.

    2. The Fifty-Percent Rule

    The fifty-per cent principle predicts that an observed trend will experience a price correction equal to about half to two-thirds of the change in price before continuing. This suggests that if a stock has been rising and gained 20%, it will lose 10% before continuing to increase. This is an extreme example, as this rule is frequently used for the short-term trends on which the technical analysts and traders trade.

    This correction is considered to be a normal component of the trend, as it is typically triggered by fearful investors taking profits early in order to prevent being caught in a true trend reversal later on. If the correction is greater than 50% of the price change, it is interpreted as a sign that the trend has failed and the reverse has occurred early.

    3. The Greater Fool Hypothesis

    According to the greater fool theory, investing is profitable as long as there is a greater fool than yourself willing to purchase the investment at a higher price. This means that you can profit from an overpriced stock as long as another party is prepared to pay a premium to acquire it from you.

    As the market for any investment overheats, you eventually run out of fools. Investing on the basis of the larger fool theory entails disregarding valuations, earnings reports, and all other data. Ignoring data is just as risky as paying too much attention to it, and hence those who believe in the greater fool hypothesis may find themselves on the losing end of a market correction.

    4. The Theory of Odd Lot

    The odd lot hypothesis uses the sale of odd lots — small blocks of shares held by individual investors – to calculate the best time to invest in a firm. When small investors sell out, investors use the odd-lot theory buy-in. The underlying idea is that small investors are frequently incorrect.

    The odd lot theory is a contrarian technique based on a deceptively simple sort of technical analysis – odd-lot sales measurement. How successful an investor or trader is in applying the theory is highly dependent on whether he investigates the fundamentals of the firms the theory suggests or simply buys blindly.

    5. Prospect Theory

    Prospect theory is often referred to as loss aversion theory. According to prospect theory, people’s views of gain and loss are distorted. That is, people are more fearful of loss than of gain. When people are presented with two contrasting prospects, they will choose the one that they believe has a lower probability of ending in a loss over the one that promises the most gains.

    For instance, if you offer a person two investments, one that has returned 5% each year and another that has returned 12%, lost 2.5 per cent, and returned 6% in the same years, the person will choose the 5% investment because he places an irrational premium on the single loss while ignoring the larger gains. Both alternatives in the previous example generate a net total return after three years.

    As a reputed share broker company we offer lowest brokerage options and a seamless online trading platform to help you with your investment journey. Contact Zebu to know more on how to get started on your share market investment journey.

  • 5 Important Technical Analysis Indicators That Investors Should Know

    Technical analysis is useful in a variety of situations. It can be used to trade stocks, futures, and commodities, as well as fixed-income securities, FX, and other financial instruments.

    Technical analysis is the art and science of predicting future prices based on the analysis of historical price movements. Using historical market data, mass investor psychology is examined. The data set comprises information about the price, the date, and the volume.

    A price chart provides the most useful information for reading a historical description of a security’s price movement over time. Charts are significantly more readable than a table of numbers. Volume bars are shown at the bottom of most stock charts. It is simple to recognise market reactions before and after major events, past and present volatility, historical volume or trade levels, and relative strength of the company vs the index using this historical image.

    Before we get into the importance of technical analysis indicators, you need to have the right technologies. At Zebu, one of the fastest-growing brokerage firms in the country, we have created the best Indian trading platform with the lowest brokerage for intraday trading. If you would like to simplify your option trading and investment game, we are here to help you out.

    The following are five indicators that every investor should be aware of:

    1) The Relative Strength Index (RSI)

    The RSI is a momentum oscillator that measures the amount and pace of directional price changes. RSI calculates the momentum of a stock with the rate at which a price rises or falls. The RSI calculates momentum by dividing the number of higher closes by the number of lower closures. The RSI of stocks that have experienced more or stronger positive movements is greater than the RSI of equities that have experienced more or stronger negative changes.

    The indicator has a 70-point top line, a 30-point lower line, and a 50-point dashed mid-line. When a price rises rapidly, it is called overbought at some time (When the RSI crosses 70). Similarly, when the price falls swiftly, it is termed oversold at some point (when the RSI passes 30). The RSI level is a gauge of the stock’s recent trading strength. The slope of the RSI is proportionate to the rate at which a trend changes. The RSI’s move is directly proportional to the degree of the movement.

    2) Moving averages
    In technical analysis, moving averages are one of the oldest and most useful technical indicators. When used in conjunction with other oscillators such as MACD and RSI, moving indicates a trend in a “smoothed” manner and can provide trustworthy signals.

    The three types of moving averages are simple moving average (SMA), exponential moving average (EMA), and weighted moving average (WMA).

    Moving averages for stocks are commonly used for 10 days, 21 days, 50 days, 100 days, and 200 days. The simple moving average is the most widely used moving average (SMA). Single SMAs can be utilised to spot a trend, but we found that using a dual or triple moving average is more effective.

    3) Stochastic Oscillator

    The Stochastic Oscillator is a momentum indicator that depicts the current close’s position in relation to the high and low ranges across a set of periods. Closing levels that are constantly near the top of the range suggest accumulation (buying pressure), while those that are consistently towards the bottom of the range indicate distribution (selling pressure). The premise behind this indicator is that prices tend to close near their highs in an upward-trending market and near their lows in a downward-trending market.

    4. Bollinger Band

    John Bollinger developed Bollinger Bands as a technical trading technique in the early 1980s. Bollinger Bands are used to define high and low points relative to each other. Prices are high in the top band and low in the lower band by definition. This definition can help with pattern recognition and can be used to compare price action to indication behaviour. Bollinger Bands are a series of three curves that are drawn in connection to stock prices. The middle band, which is usually a simple moving average that acts as the base for the higher and lower bands, is a gauge of the intermediate-term trend. Volatility, which is often the standard deviation of the same data used for the average, determines the gap between the upper and lower bands and the central band. You can change the default parameters, which are 20 periods and two standard deviations, to fit your needs.

    5) Parabolic SAR (Parabolic Stop and Reverse)

    SAR, or stop-and-reversal, is a technical analysis strategy that uses a trailing stop and reverse method to discover appropriate exit and entry locations. J. Wells Wilder came up with this strategy. Basically, one should sell if the stock is trading below the parabolic SAR (PSAR). If the stock price is higher than the SAR, it is a good time to buy (or stay long).


    As we mentioned before, investing or trading you need the right tools. We at Zebu offer the best Indian trading platform and the lowest brokerage for intraday trading. As one of the best brokerage firms in the country, we have created a powerful trading platform that makes investing easy for you. To know more about its features, please get in touch with us now.

  • What Exactly Is Insider Trading?

    The purpose of investing in stocks and other securities is to accumulate wealth. For some investors, the sooner this aim is met, the better. Traders develop techniques to trade that maximize their profit in the field of trading, particularly when trading equities and shares. Of course, when trading is taking place, the stock markets and exchanges have their fair share of malpractice, and some traders will go to considerable measures to make a profit. Insider trading, as the term implies, is trading by people who have insider knowledge of a company’s stock and its trends.

    Before we get into more about insider trading, it is important to know that you need to analyse them for maximum profits. At Zebu, one of the fastest-growing brokerage firms in the country, we have created the best Indian trading platform with the lowest brokerage for intraday trading If you would like to simplify your option trading game, we are here to help you out.


    1. How insider trading works

    Insider trading is defined as trading in stocks, such as bonds and equities, by specified corporate ‘insiders’ who have unique access to information. Simply put, these insiders are aware of a unique security before any information about it reaches the general public. Insider trading occurs when insiders invest in equities while the general public is unaware of the stock. If such trade is discovered by regulatory authorities, the ‘insider’ will face severe consequences.

    2. When is it Illegal to Trade Insider Information?

    According to SEBI laws, the Securities and Exchange Board of India, or SEBI, is strongly opposed to insider trading. The fact that insider trading offers some investors an unfair edge in the stock market is the explanation behind the practice being labeled as “illegal.” Insider trading is usually done by people who, as a result of their job, have exclusive access to specific types of strategic information about a company’s shares. Knowing a company’s private information can have a big impact on whether you invest and make money or not. Insiders, for example, may know if a company’s quarterly results will reveal a large profit, causing stock prices to rise. They can take advantage of this by investing a large sum of money in the stock in question, nearly ensuring a large profit. Insider trading is regarded criminal from this perspective. Insider trading, on the other hand, is not unlawful when investors buy stocks and all concerned investors are aware of certain information that has an impact on their trading profit or loss.

    3. Which Information is insider information?

    Material information regarding a stock or a firm in the trading world refers to any information that could have a major impact on a trader’s or investor’s decision to trade (buy or sell) specific securities. Non-public information is information that is not formally available to the public. Insiders use substantial information that is not available to the general public to gain an unfair advantage in trading. Insider trading is prohibited regardless of how the information was obtained or whether the ‘insider’ is employed by the company. As an example, suppose a friend tells you about insider information (non-public information). This information is then passed on to a family member. On the said stock, the family member trades using this knowledge. In such a circumstance, all three parties implicated might face criminal charges or severe penalties.

    As we mentioned before, investing or trading you need the right tools. We at Zebu offer the best Indian trading platform and the lowest brokerage for intraday trading. As one of the best brokerage firms in the country, we have created a powerful trading platform that makes investing easy for you. To know more about its features, please get in touch with us now.

  • P/E Ratio and How To Use It

    When determining a company’s value, the price-to-earnings (P/E) ratio compares its current share price to its earnings per share (EPS). Along with P/E, the term “price multiple” or “profit multiple” can be used to describe the P/E ratio.

    When comparing apples to apples, investors and analysts use P/E ratios to determine the worth of a company’s stock. Comparisons between companies and aggregate markets can be made against each other or over time using this metric.

    To calculate P/E, you can use either a trailing or forward-looking approach.

    For any form of trading or investing you need to have the right technologies. That is why you need the best online trading company that provides you with the best stock trading platform. We at Zebu find that it is our obligation to provide our traders with the best trading accounts so that they can invest with ease.

    Formula and Calculation for the P/E Ratio

    The following is the formula and calculation utilised in this process.

    Divide the current share price by the earnings per share to get the P/E ratio (EPS).

    If you type in a stock’s ticker symbol into any financial website, you’ll get the current stock price. However, this is a more concrete value that shows what investors currently have to pay for the shares.

    In general, there are two kinds of EPS. “TTM” stands for “trailing 12 months” and helps investors understand the company’s valuation over the last year. It’s common for a company’s results report to provide EPS forecasts. It is a This is the company’s best educated forecast as to how much money it will make in the future. The trailing and projected P/E ratios are based on different versions of EPS.

    Understanding the Price-to-Earnings (P/E) Ratio

    An investor’s and an analyst’s favourite way to estimate a stock’s value is through its price-to-earnings ratio (P/E). The P/E essentially tells an investor if a stock is overvalued or undervalued. Additionally, the P/E ratio of one company can also be compared to that of other companies in its industry or the Nifty 50 Index.

    Analysts that are interested in long-term valuation patterns may use the P/E 10 or P/E 30 measures, which average earnings over the previous 10 or 30 years, respectively. Because these longer-term measurements can correct for changes in the business cycle, they are frequently used when trying to judge the overall worth of a stock index.

    When determining if a company’s share price appropriately represents projected earnings per share, analysts and investors look at its P/E ratio.

    Forward Price-to-Earnings Ratios

    These two forms of EPS measures are used to calculate the two most prevalent P/E ratios: forward and trailing P/E. The sum of the last two actual quarters and the estimates for the future two quarters is a third, less typical form.

    Instead of using trailing figures, the forward (or leading) P/E employs future earnings guidance. This forward-looking measure, also known as “estimated price to earnings,” is useful for comparing current earnings to future earnings and for providing a clearer image of what earnings will look like—without modifications or other accounting adjustments.

    However, the forward P/E metric has flaws, such as firms underestimating earnings in order to surpass the predicted P/E when the next quarter’s results are released. Other corporations may overestimate their forecast and then adjust it in their next earnings report. Furthermore, outsider analysts may make forecasts that differ from those provided by the corporation, causing confusion.

    Trailing Price-to-Earnings Ratio (P/E)

    By dividing the current share price by total EPS earnings over the last 12 months, the trailing P/E is calculated. It’s the most often used P/E ratio since it’s the most objective—assuming the company honestly reported earnings. Because they don’t trust other people’s profits projections, some investors prefer to look at the trailing P/E. However, the trailing P/E has some flaws, one of which is that past performance does not always predict future behavior.

    As a result, investors should make investments based on future earnings potential rather than historical performance. It’s also a concern that the EPS number remains constant while stock values change. The trailing P/E will be less representative of those changes if a major company event sends the stock price much higher or lower.

    Because earnings are only reported once a quarter, while stocks trade every day, the trailing P/E ratio will alter when the price of a company’s shares fluctuates. As a reason, the forward P/E is preferred by some investors. Analysts expect earnings to rise if the forward P/E ratio is lower than the trailing P/E ratio; if the ahead P/E is greater than the current P/E ratio, analysts expect earnings to fall.

    As we mentioned earlier you need to have the right technologies to trade profitably. That is why you need the best online trading company that provides you with the best stock trading platform. We at Zebu are obligated to provide our traders with the best trading accounts so that they can invest with ease.