Large Cap vs Mid Cap vs Small Cap: Key Differences That Actually Matter
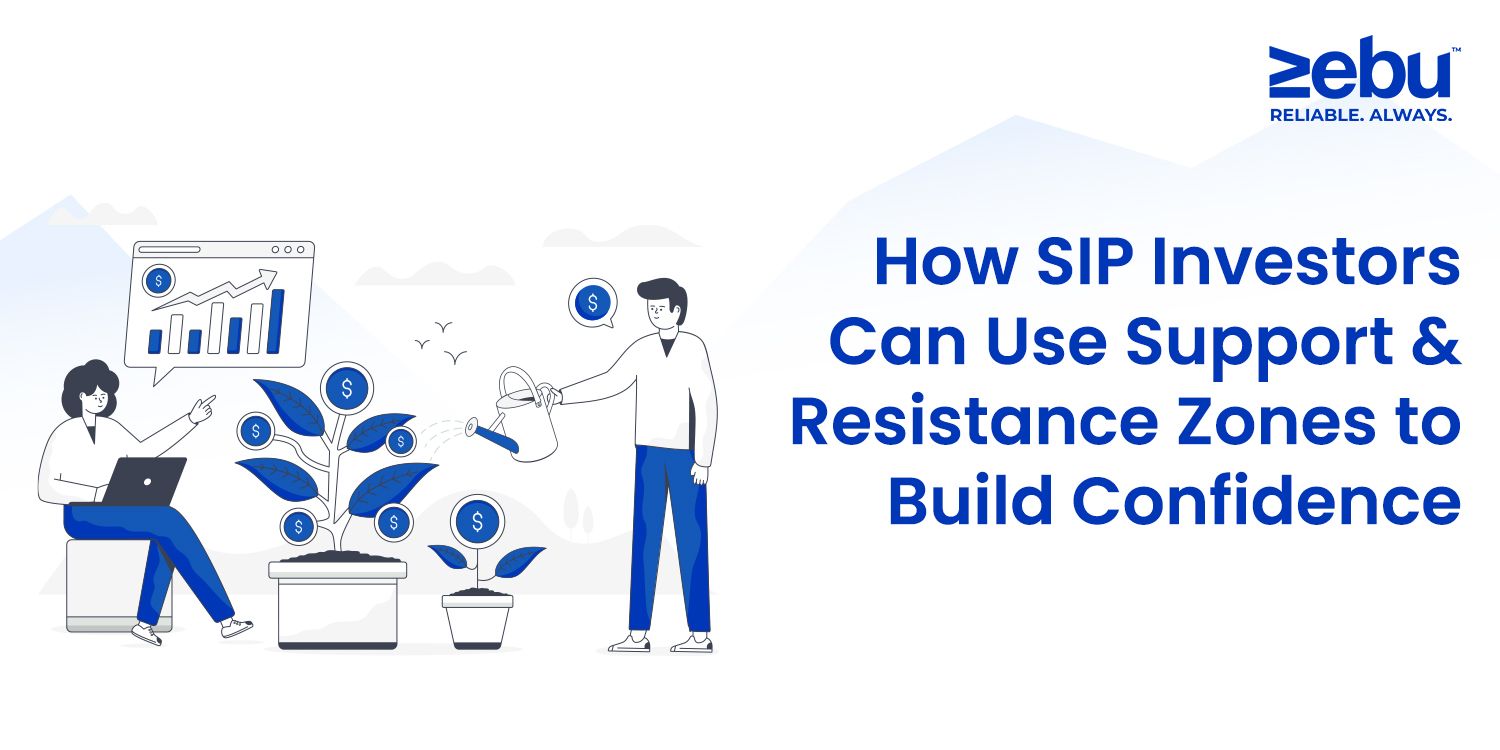
How SIP Investors Can Use Support & Resistance Zones to Build Confidence
SIP investing is supposed to be simple. You pick a good fund or stock, set a monthly amount, and automate the rest. No emotions. No overthinking. Just consistency.
But even the most disciplined SIP investors check their holdings once in a while—and wonder:
“Did I just buy at the top again?”
“Should I pause and wait for a dip?”
“Is this stock really at a good level?”
That’s where a basic understanding of support and resistance comes in—not to time the market, but to feel more in rhythm with it.
At Zebu, we’ve seen more SIP users start to explore charts—not to become traders, but to make peace with volatility. And in that process, support and resistance zones have become quietly useful.
What Are Support and Resistance Zones—Really?
Forget the technical definitions for a moment. Here’s the simple version:
- Support is a level where a stock or index tends to stop falling. It’s where buyers feel the price is “worth it.”
- Resistance is a level where it tends to stop rising. It’s where sellers often step in.
Think of support as a floor, and resistance as a ceiling. Prices may bounce off them or break through—but they often matter because many people think they matter.
They’re not fixed lines. They’re zones. And they’re not predictions. They’re just reference points.
Why Should SIP Investors Care?
If you’re investing regularly—monthly, quarterly, or even annually—knowing where support and resistance zones lie can help you:
✅ Stay calm when prices dip near known support
✅ Avoid chasing stocks that are right at long-term resistance
✅ Choose better entry points when you manually top up
✅ Understand if recent performance is part of a pattern—or a potential shift
Again, this isn’t about stopping your SIP every time a resistance is near. It’s about context.
A Practical Example
Let’s say you’re doing a SIP into a quality mid-cap stock—say, ABC Industries.
You notice the stock has bounced from ₹720–740 three times in the last six months. That’s a support zone.
On the upside, every time it hits ₹840–860, it pulls back. That’s a resistance zone.
Now imagine your SIP executes at ₹850. It’s still okay—you’re building long-term. But knowing this zone exists might help you:
- Manually top up if it dips again near ₹740
- Pause optional additions if it runs ahead of earnings and hits ₹860
- Stay patient if it dips post-purchase, because you expected that zone to attract buyers
This isn’t prediction. It’s preparation.
What the Market Is Doing Right Now
In July 2025, Nifty is trading around 23,400, while Sensex hovers above 77,000. We’ve seen:
- Recent support near 22,900 on Nifty
- Resistance around 23,500–23,600
- PSU banks and capital goods showing relative strength
- FMCG stocks pausing after strong runs
If you’re SIP-ing into index ETFs or sector-specific funds, this information gives you a map—not a rulebook.
For instance, a PSU-focused SIP may ride short-term momentum. An FMCG-focused one may cool temporarily. But support zones below recent dips suggest buyers remain active.
Using Support & Resistance Without Overthinking
You don’t need to spend hours on charts. Here’s a simple routine:
- Log into Zebu → Check the stock or index you’re investing in
- Use basic chart view → Select 6-month or 1-year timeframe
- Look for clusters → Price zones where moves repeatedly slow, reverse, or gather volume
- Set alerts → Use Zebu tools to notify you when your asset nears those zones
Then forget it until you need it.
These zones aren’t guarantees. But they help filter noise. Instead of reacting to a 3% drop, you’ll think, “Ah, back near support.” That mindset shift matters.
Common Questions We Hear
Q: Should I stop my SIP near resistance?
Not necessarily. But you might choose to pause optional top-ups or diversify new funds elsewhere.
Q: What if support fails?
That happens. It doesn’t mean your SIP was wrong. But it might prompt a deeper look at why the stock or fund broke structure—news, results, sentiment.
Q: Can I do this without charts?
Basic support/resistance data is built into many Zebu screens. You don’t need to draw anything. Just glance.
Where This Really Helps: Emotional Control
The real benefit of using support and resistance as an SIP investor is not better timing. It’s less panic.
- You’ll stop feeling like every market dip is a mistake.
- You’ll stop buying out of FOMO at resistance.
- You’ll ride volatility with context.
We’ve seen this play out across Zebu’s delivery-based users. The ones who use charts—not obsessively, but observationally—tend to hold better, longer, and with more confidence.
Zebu Tools That Help You Do This Quietly
Our platform supports non-intrusive investing. That means:
- Chart views that aren’t cluttered with signals
- Alerts tied to price levels—not just price changes
- Watchlist summaries that show bounce zones and momentum levels
- Delivery snapshots that help you track entry points over time
Because most SIP investors don’t want noise. They want a calm check-in now and then—enough to feel grounded.
Final Thought
Support and resistance zones won’t change your financial goals. But they might help you stay with them longer.
If your SIP is into something solid, short-term movements shouldn’t throw you. But knowing where the price has historically turned can anchor your confidence—and make you feel less like you’re flying blind.
At Zebu, we don’t want every investor to become a chart reader. We just want every investor to feel like they can see what matters.
Because investing, when it’s done quietly and consistently, shouldn’t feel confusing.
It should feel yours.
Disclaimer
This article is meant for educational purposes only and does not constitute investment advice or financial recommendations. Support and resistance zones are based on historical data and do not guarantee future performance. Zebu encourages users to consult with a certified advisor before making investment decisions based on technical indicators or personal interpretations.