Tag: chart patterns

  • How To Trade With Support And Resistance


    Title Page Separator Site title

    Technical analysts use a number of rules to predict how much stocks will go up or down in the future. Once you know what a trend is, the next important idea in technical analysis is support and resistance.

    The theory of support and resistance

    According to technical analysis, when the price of a stock reaches certain predetermined price points, it tends to stop and move in the opposite direction.

    Support level: This is the point where the price of a stock stops going down. It’s possible that the price will go up instead of down. At this point, it is likely that the demand from buyers will be much higher than the demand from sellers.

    Resistance level: The opposite of a level of support is a level of resistance. It is a price level (ceiling) above which the stock price is not expected to rise. At this price, the market for this stock is better for sellers than it is for buyers.

    What does support mean?

    The support and resistance levels on a candlestick chart might help you figure out the target price at which to buy or sell. The support level is where the market expects more buyers than sellers. The price at which traders can expect to see the most buying interest in a stock is called the support level on the chart.

    In a falling market, the support-resistance indicator, which is an important level market player to watch for, is often a sign to buy. The support line is formed when the price of a security goes down and the demand for shares goes up.

    What is resistance?

    On a candlestick chart, a price has reached the resistance level when there are more sellers than buyers. Resistance level is a price point on the chart where traders expect to sell as much of a certain stock as they can. It keeps the price from going up even more.

    Since resistance is always higher than the current market price, it is often a sign to sell. In a bullish market, the resistance level is one of the most important things that traders pay close attention to. Support and resistance are, in a nutshell, the exact opposites of each other.

    By looking at the support and resistance levels, the trader can get an idea of how the price of a stock will move. But there is always a chance that the stock price will go above these levels. When this happens, which happens often, a new level of support and resistance is set up.

    If the support level is broken, the stock price will keep falling until it finds a new level to support it. Also, if the stock price breaks through the resistance level, it keeps going up until it hits a new resistance level.

    Resistance and Support: How Reliable Are They?

    Even though support and resistance can tell you when to buy or sell, you shouldn’t rely on them alone. Or, to put it another way, before deciding whether or not to buy or sell a certain stock, you should think about a number of other things.

    When it comes to technical analysis,
    Predicting the future price of a stock is the most important (and hard) part of analysis for a trader in the stock market. The next high (or low) price cannot be predicted with any level of reliability.

    So, the idea of support and resistance is a good way to understand how prices change. Support and resistance levels help traders make decisions because they let them see patterns.

    For example, if a trader sees that a stock has reached a support level, he could buy more shares. This is done so that the stock has a better chance of coming back. In a similar way, the trader may sell his shares and make money when the stock reaches a level of resistance.

    When a stock’s price reaches these levels, you should always be careful because the area between the support and resistance levels is known to be very volatile.

    Conclusion

    Traders can use the idea of support and resistance to spot trends in the stock market and take advantage of them.

    This doesn’t mean, though, that the stock will never go above a support or resistance level. The price of a stock can always go up or down. Also, as a trader, you shouldn’t make trades based only on these levels.

  • Trendline Trading Strategies For Beginners

    Individual traders tend to utilise technical analysis more frequently than fundamental analysis, so trendlines are particularly popular in both forex and cryptocurrency trading. Interest rate movements affect forex markets, yet central banks’ established interest rates seldom fluctuate. This implies that prices fluctuate in line with traders’ predictions of interest rates, which are far more difficult to interpret. Price action and analytical tools like trendlines, according to technical experts, are the most reliable ways to gauge the sentiment of traders.

    Trading strategies using trendlines

    There are other methods to employ trendlines, but in this article, we’ll go through the two most popular trendline trading techniques as well as a third, less well-known but extremely viable, strategy.

    1) Trendline reversal

    Trading in accordance with the trendline-supported trend is the aim of this technique. Either purchasing or selling near to an uptrend or downtrend line.

    Steps in the plan:

    Decide if the price is moving up, down, or sideways.
    Create a trendline that connects at least three swing points.
    the trendline be extended into the future
    A) Watch for a subsequent price contact of the trendline B) Place a limit order at the trendline (adjust as price moves)
    When the price has reached the trendline, place a trade in the trend’s direction.
    In an upswing, place a stop-loss order under the prior swing low (above the previous swing high in a downtrend)
    Place a take profit order with a minimum ratio of 2:1 to the stop loss size.
    Example of a chart: trendline bounce

    2) Trendline break-through

    Although the trendline breakout may be utilised to trade against the trend, that is not what we are promoting here. How is breaking a trendline a trend-following tactic? Trading the breakout of short-term trendlines in the direction of the main trend is how it’s done!

    Steps in the strategy: identify a long-term trend
    Wait for a price “correction” or buck the general trend.
    Create a trendline to represent this recent correction.
    Keep an eye out for the price to go over this trendline.
    A) Place a stop order past the trendline to enter on the breakout B) Buy at the break of a downtrend line or sell at the break of an uptrend line
    On the other side of the trendline, place your stop loss order.
    Place a take profit order with a minimum ratio of 2:1 to the stop loss size.

    Examples of charts: inner trendline breakout

    3) Confluence between trendlines

    The use of trendlines is effective, however no technical indicator or price action trading strategy is faultless. Using many analysis techniques and watching for possibilities when they all come to the same conclusion will always boost your chances of success on a transaction.

    For instance:

    Using Fibonacci retracements, draw trendlines
    In this illustration, a buying opportunity at a rising trendline is supported by one at the 61.8% Fibonacci retracement level.

    Moving averages and trendlines
    In this instance, a rising trendline coincides with the prominent 200-day moving average.

    Japanese candlestick designs with trendlines
    In this case, bullish engulfing candle patterns help trendline bounces.

  • How To Trade With The Trendline

    Trendlines are one of the most simple and useful tools that traders use. Read on to find out what they are, how to draw them, and the best ways to trade based on trendlines.

    What is a trendline?

    A trendline is a line that is drawn through a chart to show the trend. On price charts, trendlines are drawn to show the general direction of prices in the trading environment. Traders use this information to decide whether to buy or sell in the direction of the trend. Trendlines can be used to track the price of a stock, a currency pair, or a cryptocurrency. In technical analysis, trend lines are one of the most common ways to show how prices are moving.

    A good example of how a trendline works

    Usually, a trendline is made by drawing a straight line between a number of swing highs or swing lows. For an up-trend line and a down-trend line, the swing lows and swing highs are used. In this method, the trendline helps traders understand till when a trend can continue. These can also be thought of as dynamic support and resistance points.


    Starting on the left side of the chart and moving the line to the right is how you draw a trendline. As a general rule, a trend line must go through at least three price “swings” before it can be taken seriously.

    How to use trend lines in trading

    Use a trend line to figure out the direction of the price trend. Traders can then choose to go with the trend if they think it will keep going or against the trend if they think it will change. Both strategies use the same way to read the trendline.

    Bullish because the price is above the uptrend line, which means the trend is going up.
    Bearish because the price is below a line that shows the price is going down.

    Trend following

    Trend following is a way to trade where you buy when the price is going up and sell short when the price is going down. A common trading strategy is to use an uptrend line to figure out if the general price trend is going up. A decline can also be shown by a line going down.

    Trading against trend

    Countertrend trading is a way to trade where you sell when the price goes up and buy when the price goes down. This is more like the basic rule of investing, “Buy low and sell high.” Reversion to the mean says that after a price trend goes in one direction, it will eventually go back to its average price. This is why short-term traders trade against the trend.

    The following point is one of the most important pointers to remember while using a trendline.

    Using a trendline when there is no trend is the worst mistake you can make as a beginner with trendlines. The clue is in the name!

    The best angle for a trend line is 45 degrees. Even if the trend keeps going in the same direction, a slope of more than 45 degrees means that the price is going up too quickly and could easily break the trendline. Less than 45 degrees means that the trend is weaker and is almost trading sideways.

    Three times in total

    As a trendline goes through more swing points, more traders can see it. This makes the trendline stronger. But after five touches, the chances of the trendline “breaking” are much higher.

    Zoom out

    To see where the trend you’re trying to show with the trendline started, make sure to zoom out on your trading platform’s chart. For example, if you want to draw an uptrend, try to start your trendline at the bottom of the previous downtrend or at the swing low.

    Five trendlines zones

    Trendlines are not based on good science. Price doesn’t often hit a trendline right before it turns around. The trendlines shouldn’t be taken as a specific price but as an “area” of prices. Having this information makes it easier to choose an entry price and a stop loss.

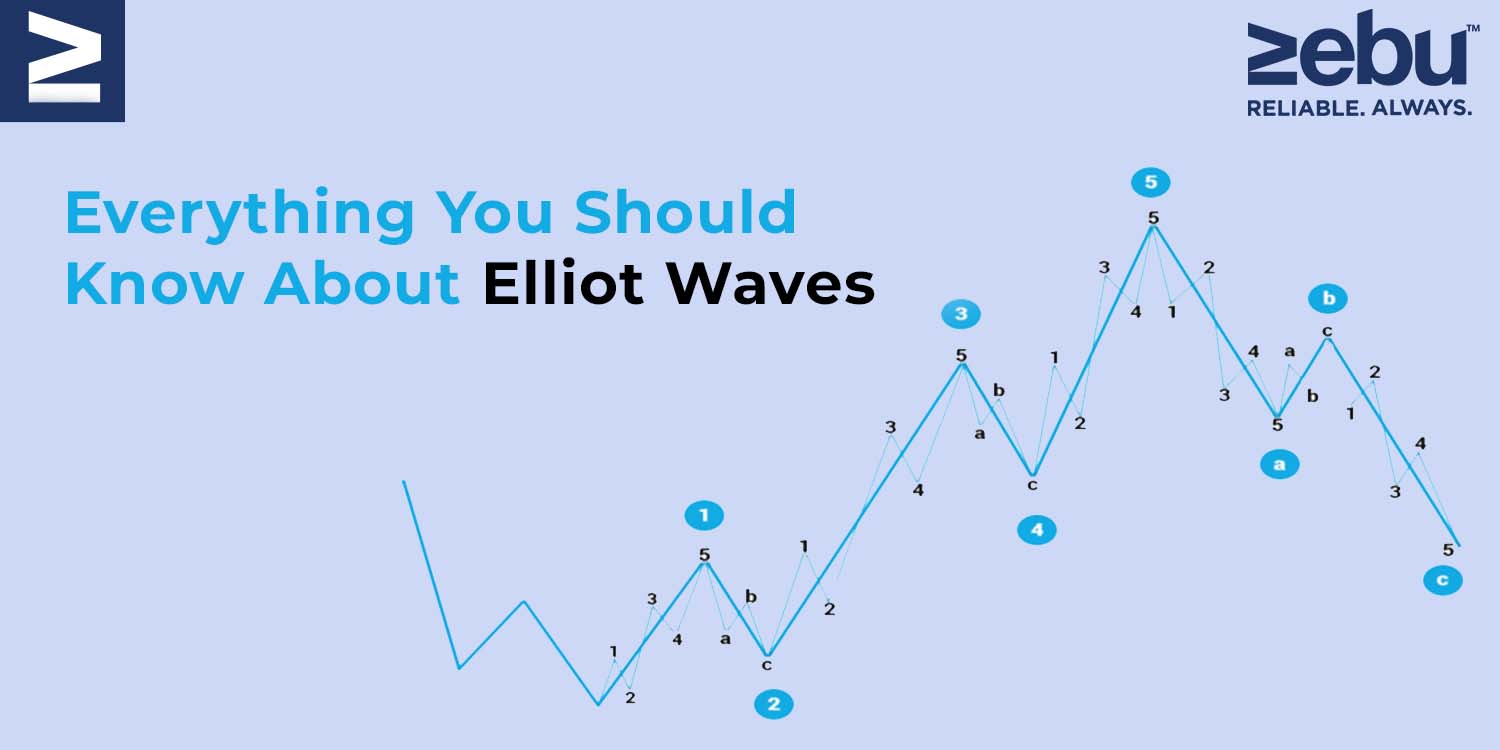
  • Everything You Should Know About Elliot Waves

    In the 1930s, Ralph Nelson Elliott established the Elliott Wave Theory. Elliott argued that stock markets, which are widely assumed to function randomly and chaotically, traded in repeating patterns.

    In this article, we’ll go over seven crucial things that you should know about Elliot Waves. But before we get into that you need to understand that investment is also about choosing the right technologies. As one of the top brokers in share market, we at Zebu offer trading accounts with lowest brokerage, and an online trading platform to help you focus only on executing your strategies efficiently.


    We’ll look at the history of Elliott Wave Theory and how it’s applied to trading in this post.

    Waves

    Elliott suggested that financial market patterns are determined by investors’ dominating psychology. He discovered that swings in popular psychology usually manifested themselves in predictable fractal patterns, or “waves,” in financial markets.

    Market Forecasts Using Wave Patterns

    Elliott made precise stock market predictions based on reliable wave pattern qualities he found. An impulse wave always exhibits a five-wave pattern because it travels in the same direction as the broader trend. On the other hand, a corrective wave net travels in the opposite direction of the main trend. On a smaller scale, five waves can be detected within each of the impulsive waves.

    Interpretation of the Elliott Wave Theory

    Five waves advance in the direction of the primary trend, followed by three waves in the direction of the corrective (totalling a 5-3 move). This 5-3 move is then subdivided into two subdivisions of the following upper wave move.

    While the underlying 5-3 pattern remains consistent, the duration of each wave varies.

    Consider the following chart, which contains eight waves (five net upward and three net downward) labelled 1, 2, 3, 4, 5, A, B, and C.


    The impulse is formed by waves 1, 2, 3, 4, and 5, whereas the correction is formed by waves A, B, and C. The five-wave impulse, in turn, generates wave 1 at the next-largest degree, while the three-wave correction generates wave 2.

    Normally, a corrective wave consists of three independent price movements – two in the direction of the primary correction (A and C) and one in the opposite direction (B). Correction waves 2 and 4 are depicted above. Typically, these waves have the following structure:

    Take note that waves A and C in this illustration move in the direction of the trend at a greater degree, indicating that they are impulsive and composed of five waves. By contrast, Wave B is anti-trend and thus corrective, consisting of three waves.

    When an impulse wave is followed by a corrective wave, an Elliott wave degree containing trends and countertrends is formed.

    As illustrated in the patterns above, five waves do not always go in a net upward direction, and three waves do not always travel in a net downward direction. When the larger-degree trend is downward, for example, the five-wave sequence is downward as well.

    To apply the idea in daily trading, a trader may spot an upward-trending impulse wave, take a long position, and then sell or short the position when the pattern reaches five waves indicating a reversal is likely.

    The Verdict

    Elliott Wave practitioners highlight that just because a market is fractal does not automatically make it predictable. While scientists recognise a tree as a fractal, this does not indicate that the route of each of its branches can be predicted. In terms of practical application, the Elliott Wave Principle, like all other analysis methodologies, has its supporters and critics.

    One of the critical flaws is that practitioners can always blame their chart reading rather than flaws in the theory. Alternatively, there is an open-ended understanding of the duration of a wave.

    As we mentioned before investment is also about choosing the right technologies. As one of the top brokers in share market, we at Zebu offer trading accounts with lowest brokerage, and an online trading platform to help you focus only on executing your strategies efficiently.