Tag: financial analysis

  • The Role of Fundamental Analysis in Building a Diversified Investment Portfolio

    Fundamental analysis is a key tool for investors who are looking to build a diversified investment portfolio. It involves evaluating the underlying financial and economic factors that can impact a company’s stock price, with the goal of identifying stocks that are likely to perform well in the long term.

    One of the main benefits of fundamental analysis is that it helps investors to make informed investment decisions based on objective data, rather than relying on market speculation or short-term trends. By analyzing a company’s financial statements, management team, market conditions, and other relevant factors, investors can gain a deeper understanding of a company’s strengths and weaknesses, and make informed decisions about whether or not to include it in their portfolio.

    In addition to helping investors to identify potential investments, fundamental analysis can also play a key role in portfolio diversification. By analyzing a wide range of companies in different industries and sectors, investors can build a portfolio that is less vulnerable to market fluctuations and is better positioned to weather economic downturns.

    There are several key steps that investors can take when using fundamental analysis to build a diversified portfolio:

    Identify your investment goals: Before you start analyzing individual stocks, it is important to have a clear understanding of your investment goals. Are you looking to generate long-term growth, generate income, or a combination of both? Knowing your goals will help you to choose the right mix of stocks and other assets to include in your portfolio.

    Evaluate the company’s financial health: One of the key factors to consider when conducting fundamental analysis is a company’s financial health. This involves analyzing its financial statements, including its balance sheet, income statement, and cash flow statement, to assess its profitability, debt levels, and other key indicators of financial stability.

    Analyze the company’s management team and business model: In addition to its financials, it is also important to assess a company’s management team and business model. This can involve evaluating the experience and track record of the management team, as well as the company’s competitive advantage and growth potential.

    Consider the industry and market conditions: It is also important to consider the industry and market conditions in which a company operates. This can involve evaluating the overall health of the industry, as well as any potential risks or opportunities that may impact the company’s future performance.

    Diversify your portfolio: Once you have identified a list of potential investments, it is important to diversify your portfolio by including a mix of stocks from different industries and sectors. This can help to reduce the overall risk of your portfolio and increase the chances of long-term success.

    In conclusion, fundamental analysis is a powerful tool for investors who are looking to build a diversified investment portfolio. By evaluating the underlying financial and economic factors that can impact a company’s stock price, investors can make informed decisions about which stocks to include in their portfolio and how to diversify their holdings to reduce risk. By following these steps, investors can increase their chances of long-term success and achieve their investment goals.
  • What is Acid Test Ratio And How Can You Use It While Investing?

    The acid test ratio, which is also called the quick ratio, is a financial measure of how quickly a company can pay off its current debts. Current obligations are debts that have to be paid back within a year. For example, a credit card balance is a current obligation.

    The ratio shows how well the business is doing financially right now.

    If a company’s acid test ratio is less than one, it usually means that its current assets are not enough to pay off its short-term debts and liabilities. A very high ratio suggests that money has been saved up and is just sitting there, not being put to good use.

    It’s important to know that when figuring out the ratio, the company doesn’t count current assets that are hard to sell quickly.

    How to find the acid test ratio

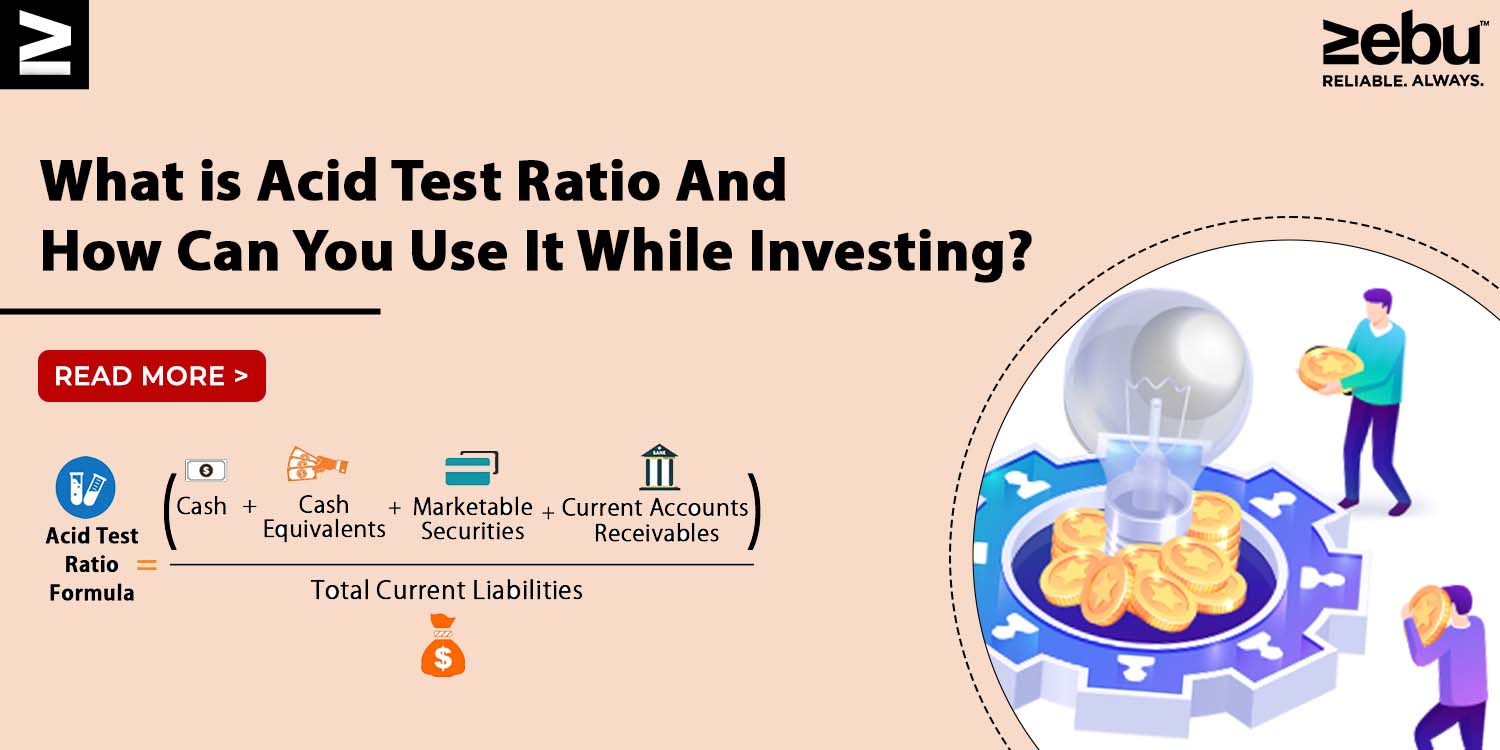
    The acid-test ratio is calculated by dividing current liabilities by (cash + accounts receivable + short-term investments). Cash and assets that can be used as cash must be included. There must also be marketable securities and other assets that can be used quickly. Accounts receivable are usually covered, but not in every business. If assets on a balance sheet, like loans to suppliers, prepayments, and deferred tax assets, can’t pay off liabilities in the near future, they must be taken off. The denominator should include all current liabilities, which are debts and commitments due within a year.

    The limits of the Ratio

    If the company’s financial data is inaccurate, it will have accounts receivable that require longer than usual to be collected.

    Also, it gives a false picture of the current liabilities that are due but won’t be paid for a while.

    A low acid test ratio doesn’t always mean that a business strategy that depends on stock is in bad financial shape.

    The acid test ratio is different from the current ratio

    The current ratio, also called the working capital ratio, shows how quickly a company can make enough cash to pay off all its debts if they all come due at once.

    On the other hand, the acid test ratio is a more cautious measurement.
    While the current ratio includes assets that can be converted to cash within a year, the acid-test ratio only includes assets that can be done so within 90 days or less.

  • How To Choose Between Value and Growth Stocks?How To Choose Between Value and Growth Stocks?

    When it comes to making investments, investors have a lot of choices, such as debt vs. equity, active vs. passive funds, mutual funds vs. stocks, value vs. growth investing, and so on. Investors can choose between growth investing and value investing when they put money into the stock market.


    Both strategies help investors make more money on the stock market, but they do so in different ways and are widely used.

    Fundamental research is a good way to tell the difference between value stocks and growth stocks. Let’s look closely at each type before we say what makes them different.

    Before we get into choosing growth stocks, the primary aspect of every trader’s life is technology. At Zebu an online stock trading company we offer the best
    online trading platform
    with the lowest brokerage options

    Investment in growth stocks
    The Growth Investing strategy looks for companies that have a higher chance of outperforming their earnings and are expected to keep giving high returns on profit growth. Small-cap, mid-cap, and large-cap funds all have growth stocks. Investors are willing to put money into something and pay a higher price if they think it will grow or give them a higher return soon.

    Investors are optimistic about the company’s business plan and its chances of growth in the near future. Several things, like the company’s position in the market or the belief that its next line of products will be well received, can give investors confidence.

    Also, these stocks are more “expensive” than those of their competitors because their price-to-earnings ratio is higher. This is why investors are willing to pay more for these stocks than they are currently making because they think the price will be worth it in the long run.

    Investment in value stocks

    The value investing method usually looks for stocks that are undervalued, or whose current market price is lower than what they are really worth. So, they move along slowly, but they are worth more in the long run. The idea is that the market will quickly see how valuable it is, and the share price will then “catch up,” leading to big profits. So, if the actual value of a share of stock is Rs. 100, but it is currently trading at Rs. 75, an analyst will think this is a good value pay.

    There are many things that can cause value stocks to be undervalued, such as the economy, legal problems, bad press, disappointing earnings, etc. All of these things make us question how well the company will do in the long run. But they come back slowly. Value stocks are best for investors who want to hold them for a long time, and their prices may be more likely to change than those of growth stocks.

    DIFFERENCE BETWEEN VALUE V/S GROWTH INVESTING

    An important difference between value stocks and growth stocks is that value stocks have a better chance of beating their peers when interest rates go down and corporate earnings go up. But when the economy slows down, it will be the first to pay the price. Value stocks, on the other hand, may do well in the early stages of an economic recovery, but they are more likely to do poorly in a long-term bull market, when constant media coverage, a rumor, or a news story about the company’s management could cause a panic sell-off.

    VALUE V/S GROWTH INVESTING: WHICH IS BETTER?

    There is no right or wrong way to choose between growth investing and value investing when investing in the stock market. Instead, each method has its own set of goals, benefits, and risks. Because of this, it is best to use a combination of investment styles instead of just one, since both have their pros and cons.

    The primary and most critical aspect of every trader’s life is technology. At Zebu an online stock trading company we offer the best online trading platform with the lowest brokerage options.

  • 10 Things You Should Consider Before Investing In An IPO

    Investing in an IPO can be a great way to build wealth with promising companies. However, if last year is anything to go by, IPOs can be extremely tricky to invest in. If you are purely investing in an IPO to benefit from the listing gains, we suggest that you find promising companies, apply to the IPO and sell your shares on the day that it gets listed. However, if you are a long term investor, you can hold on to your gains.

    In this blog, we’ll talk about what an IPO is and the 10 Things to Check Before Investing in them.

    1. Read the Red Herring Prospectus. A company files the Draft Red Herring Prospectus with SEBI when it wants to sell its shares to the public to raise money. This document explains how the company plans to use the money it gets from the public and what risks investors might face. So, people who want to invest in an IPO must read this document first.

    2. Reasons for Raising Money: It’s important to know what the company plans to do with the money it gets from the Initial Public Offering. One should find out if the company wants to pay off its debts or if it wants to raise money to grow the business, or use the money for other business purposes. This shows that the money will be used well in the business, which is a good sign for an investor.

    3. Know the business model: Before investing in the Initial Public Offering, investors should know what kind of business model the company has. Once they know what kind of business the company is in, the next step is to find a new market opportunity. This is because the size of the opportunity and the company’s ability to get a share of the market can make a big difference in the company’s growth and shareholder returns. If investors don’t understand what the company does for business, they shouldn’t buy into its IPO.

    4. Analyzing the background of the company’s management and promoters: It’s important to find out who runs the business since they are the company’s backbone. Investors should look at both the people who started the company and the people who run it since both play important roles in how the company works. The company’s management is a big part of what moves the business forward. One should look at the qualifications and length of time that the company’s top management has been there. This gives an idea of how the company works.

    5. The company’s strengths and weaknesses: Before putting money into a company’s IPO, you should do a SWOT analysis of the company. The DRHP can be used to figure out what the company’s biggest strengths and weaknesses are. Investors should find out where the company stands in the industry it is in. People who want to invest in a business should try to learn as much as they can about the company and the strategies it uses.

    6. The company’s valuation: Investors should also check the company’s valuation, since the offer price could be too low or too high depending on the industries it works in and its financial ratios.

    7. The company’s health: It’s important to look at how well the company has done financially over the past few years to see if the company’s sales or profits have been growing steadily. If the company’s sales are going up, it might be a good idea to invest in its Initial Public Offering. Before putting money into an IPO, investors need to know how healthy the company’s finances are.

    8. Investment Horizon: An investor should know what their investment horizon is before putting money into an IPO. They should decide if they want to buy shares in the IPO just to trade them on the day it is listed or if they want to keep them for a longer time. The reason for this is that a trading strategy would depend on how the market is doing right now, while a long-term strategy would depend on how the company is doing in its core areas.

    9. Comparable Peers: Investors should also look at who the company’s competitors are. The DRHP compares the company to its peers in terms of both its finances and its value. Investors can look at how the company is valued compared to its peers to see if it is priced fairly.

    10. The company’s potential in the market: Investors should also look at the company’s opportunities and threats in the sectors where it operates. This is important for long-term investors to determine if the investment is worth it.

  • How To Make Sense Of A Company’s Earnings Report

    When you look at a company’s financial report, the words “earnings” and “profit” jump out at you. Which profit should you look at when judging a business? Why do we need so many ways to measure profit? How do analysts figure out the ratios they keep talking about?

    Here is a quick breakdown of the important terms of an earnings report.

    Before getting to understand a company’s earnings report, we would like to inform you that at Zebu, an online stock broker company we offer lowest brokerage for intraday trading and the best online trading platforms.

    1. Gross profit

    What it is: Sales minus the cost of making those sales. To figure out the cost of goods sold, you add the purchases made during the period to the net stock.
    The meaning: Not the company’s total income because it doesn’t count “other income” like rent.

    2. EBITDA

    What it is: Earnings before interest, taxes, depreciation, and amortisation. To figure out net profit, take gross profit and subtract operating, general, administrative, and selling costs.
    The meaning: Not a true picture of how profitable a company is because it includes taxes and interest payments, which can be very high for some companies.

    3. EBIT

    What it is: Income before interest and taxes are taken out. Operating profit is another name for it. Depreciation and amortisation costs are subtracted from EBITDA to get this number.
    The meaning: This shows how much money the company makes from its main business.

    4. EBT

    What it means: Income before taxes. Interest costs are subtracted from EBIT to get this number.
    What it means is that tax deductions are different for each company. EBT makes it easy to compare how companies use loans to increase their return per share because it includes taxes but not interest.

    5. NET PROFIT

    How it works: Calculated by taking the tax out of the EBT. Also called net profit (PAT).
    The meaning: Since all payments have been made, it shows how much the company made in the end. PAT is used to figure out the dividends.

    6. EPS

    This is the earnings per share. This number is found by dividing PAT by the number of shares in circulation.
    The meaning: It shows how much each share of a company is making. When calculating EPS, dividends on preference shares are not taken into account.

    7. P/E

    How it works: Divide the current share price on the market by the earnings per share to get this number.
    The meaning: This shows how much an investor is willing to pay for one rupee of a company’s earnings. Analysts use it to figure out if a company is undervalued or overvalued.

    8. Operating ratio

    It is figured out by dividing operating costs by net sales (revenue). It shows how much of the income goes toward operating costs. The lower the ratio is, the better the company is. This shows that the company has enough cash on hand to grow and pay interest.

    9. Net profit ratio

    It’s PAT divided by net sales. This shows how much money a company makes on every Rs 100 sale. If the ratio is high, it means that the company is making a lot of money.

    10. Debt-equity ratio

    It shows how financially stable a company is and is found by dividing debt by equity. If the ratio is less than one, the company is using more of its own money and less debt. If the ratio is more than one, the company is using more debt than its own money. Since interest costs are fixed, a company with earnings that change a lot can take a risk by having a lot of debt. Companies that make a lot of money can increase the returns for equity shareholders by taking on a lot of debt.

    These are the key terms that you should keep in mind while analysing a company’s performance.

    At Zebu, an online stock broker company we offer lowest brokerage for intraday trading and the best online trading platforms.

  • How Exactly Does Inflation Affect The Market?

    Most of the time, we think of inflation as a bad thing for stock markets. It’s not hard to figure out why. When inflation is high, the cost of living goes up and people have less money to spend. When inflation goes up, people earn less in real terms, and when inflation is taken into account, this means that their returns are lower. Second, when inflation goes up, interest rates go up, which also raises the cost of equity. There are also times when the effect of inflation on the stock market is seen as a good thing. So, what does inflation mean for the Indian stock market? Does inflation have anything to do with investments? When inflation goes up, do people tend to invest more or less? Most importantly, how does inflation affect the indices of the stock market, especially the Nifty and the Sensex?

     Let’s look in more depth at each of these points. As one of the biggest share broker companies Zebu has a huge team working to make your trading and investment journey as seamless as possible in our efforts to do that we offer the best trading accounts with lowest brokerage for every trade you make.

    1. How inflation affects the amount of money investors can spend What does it mean for prices to go up? Inflation is when the prices of goods and services go up over and over again. In India, the CPI inflation and the WPI inflation are used to measure both retail inflation and producer inflation. Usually, the CPI is a better way to measure consumer inflation because it is more accurate and has more to do with buying power. As inflation goes up, the value of the money you will get in the future goes down. That’s what the “present value” of money means. When inflation is 5%, your Rs.100 receivable from a year from now is worth Rs.95 today. When inflation is 10%, your Rs.100 receivable from a year from now is only worth Rs.90 today. With the same amount of money, you can buy less when your purchasing power goes down. This is usually bad for consumer-driven stocks like FMCG and consumer durables because people’s ability to pay goes down. This means that these companies will have to lower prices and make less money.

    2. Inflation affects interest rates, which in turn affects prices. What happens to bonds and stocks when the inflation rate goes up? Let’s start with bonds. When the rate of inflation goes up, so do interest rates or bond yields. We’ve seen this happen in the last six months, when inflation expectations have gone up and bond yields have gone up sharply by 125 basis points. So that the Yield To Maturity or total rate of return of these bonds stays about the same, when bond yields go up, bond prices will go down. When the price of a bond goes down, people who own bonds, like banks and people with mutual funds, lose money. This is why banks tend to lose money when interest rates go up.

    How about stocks? When both inflation and interest rates go up, the cost of capital goes up as well. The cost of capital is the sum of the costs of equity and debt. And when bond yields go up, the cost of running a business goes up. This means that the company’s future cash flows will be worth less. We know that future cash flows are taken into account when figuring out how much a stock is worth. When the rate of discounting goes up, it makes sense that the value of an equity will go down. In a strange way, higher inflation is good for stocks in the medium to long term. Even though inflation may be bad for bonds and stocks in theory, we can’t forget that it also has a good side. Usually, rising inflation means that GDP growth is getting better.


    Title Page Separator Site title

    Even in the US and Japan, the big economic battle is all about getting inflation back to the 2% level. That is thought to be the level where growth will start to happen. In fact, if you look at the growth of the world and even India over the last 20 years, the GDP has never grown significantly when inflation was low. Even though ridiculously high inflation can make it hard to buy things, a certain level of inflation is needed to encourage businesses and producers. So the real problem is inflation which gets too high. At Zebu, we have a huge team working to make your trading and investment journey as seamless as possible in our efforts to do that, we offer the best trading accounts with lowest brokerage for every trade you make.

  • Face Value Vs Book Value Vs Market Value

    In finance, words like Face Value, Book Value, and Market Value are used very often to determine the value lowest brokerage e of a company. There is a lot of confusion about these terms, and some people think they’re all the same. Is it possible for them to be used interchangeably, and if not, what is the difference between their book values and face values?

    When it comes to stock selection, do these terms really make a difference?

    If you are someone who trades or invests regularly then you understand the importance of using the right technology. We at Zebu, as one of the best share broker in the country, offer an online stock trading platform with lowest brokerage for intraday trading best suitable for full-time traders and investors.

    Face Value

    Face Value During the earliest phases of the offering, the value of a company’s common stock is calculated and recorded on the balance sheet. Original cost might be referred to here. However, it is not an accurate representation of the market value.

    For example, the stock’s FV does not fluctuate and changes when a corporation goes through a stock split. In splitting the stock, the face value is taken into consideration rather than the market value. There are many different ways to split a stock, such as a 1:2 split, which will result in a change in the stock’s face value. As a result, the stock market’s value is likewise altered.

    Dividends are calculated per share or per percentage of the face value of the share. As an example, if the dividend is declared to be 80 percent and the stock has a face value of Rs 10, each share will receive Rs 8. As a result, investors should always focus on dividend amount rather than dividend % when evaluating a company.

    Face Value is based on the following two factors: Equity share capital and outstanding shares

    Equity share capital divided by the number of shares in issue equals the “face value.”
    As a result, the face value of each share is nothing more than the amount of equity stockholders have invested. It’s a theoretical number that doesn’t change.

    Book Value

    The term “book value” refers to the value of a company’s books (accounts) that is reflected in its financial statements or net worth. If all the firm’s assets are sold and all of its liabilities are repaid, this is what the company is worth. The Free equity of a company, to put it another way, is reflected in this metric. The fluctuation in Book Value is extremely rare and occurs just once a year as a result of the company’s overall performance.

    Using BV, you can see if the stock of a company is overvalued, undervalued, or just right. A company’s book value must be adjusted if it has a component of minority stake that is profit in the books due to a sister business under it.

    (i) Book Value = Total Assets – (Total Liabilities – Current Liabilities)

    (ii) Book Value per share = Face Value + Reserve per share

    Book Value and Face Value are linked in the second formula.

    There are few drawbacks to book value, such as the fact that it is disclosed on an annual basis. An investor won’t know the company’s book value has changed over time until after the reporting. There may be revisions to this accounting item that are difficult to understand and estimate. It is not effective for businesses that rely largely on human capital because only tangible assets are considered in the computation of book value.

    Market Value

    It is possible that the stock’s market value does not correspond to its fair value, which is determined by the stock’s current price on the exchange. It’s a measure of how much a business is worth. When the stock market fluctuates, so does MV. In the short term, it is influenced by the mood of the market, but in the long run, it is determined by the results of the company’s operations. It is the price at which we buy or sell the shares on the open market. Consequently, this is the most critical information for stock trading. This formula is used to determine a company’s market value.

    Market Value = Current Stock Price * Number of shares outstanding

    Market capitalization (MV) is another name for MV.

    Both tangible and non-tangible assets are taken into account when determining market value. Market value, on the other hand, is based on a shaky foundation. The market value of a firm can be affected by a variety of factors, including profitability, performance, liquidity, and even simple news. As a result, one might conclude that a company’s market value represents its current trend.

    Market vaue Vs Book Value
    If the stock is overvalued, undervalued, or just right, investors analyse the Book Value and Market Value.

    If the market value of a firm is lower than its book value, this implies that the market has doubts about the company’s future. Or, to put it another way, investors believe that the company isn’t worth what it’s worth on paper, or that future earnings will be insufficient. Value Investors, on the other hand, are on the lookout for such businesses because they believe the market is overvaluing them.

    If the market value of a firm is more than its book value, this shows that it is being valued more highly by the market. Therefore, investors expect that the company’s book value will rise in the future due to its good potential for growth, expansion, and increased earnings. Such businesses are considered attractive by investors. Stocks that are already trading at a high price may also be considered overvalued or overbought.

    As mentioned earlier If you are someone who trades or invests regularly then you understand the importance of using the right technology. We at Zebu, as one of the best share broker in the country, offer an online stock trading platform with lowest brokerage on intraday trading best suitable for full-time traders and investors.

  • P/E Ratio and How To Use It

    When determining a company’s value, the price-to-earnings (P/E) ratio compares its current share price to its earnings per share (EPS). Along with P/E, the term “price multiple” or “profit multiple” can be used to describe the P/E ratio.

    When comparing apples to apples, investors and analysts use P/E ratios to determine the worth of a company’s stock. Comparisons between companies and aggregate markets can be made against each other or over time using this metric.

    To calculate P/E, you can use either a trailing or forward-looking approach.

    For any form of trading or investing you need to have the right technologies. That is why you need the best online trading company that provides you with the best stock trading platform. We at Zebu find that it is our obligation to provide our traders with the best trading accounts so that they can invest with ease.

    Formula and Calculation for the P/E Ratio

    The following is the formula and calculation utilised in this process.

    Divide the current share price by the earnings per share to get the P/E ratio (EPS).

    If you type in a stock’s ticker symbol into any financial website, you’ll get the current stock price. However, this is a more concrete value that shows what investors currently have to pay for the shares.

    In general, there are two kinds of EPS. “TTM” stands for “trailing 12 months” and helps investors understand the company’s valuation over the last year. It’s common for a company’s results report to provide EPS forecasts. It is a This is the company’s best educated forecast as to how much money it will make in the future. The trailing and projected P/E ratios are based on different versions of EPS.

    Understanding the Price-to-Earnings (P/E) Ratio

    An investor’s and an analyst’s favourite way to estimate a stock’s value is through its price-to-earnings ratio (P/E). The P/E essentially tells an investor if a stock is overvalued or undervalued. Additionally, the P/E ratio of one company can also be compared to that of other companies in its industry or the Nifty 50 Index.

    Analysts that are interested in long-term valuation patterns may use the P/E 10 or P/E 30 measures, which average earnings over the previous 10 or 30 years, respectively. Because these longer-term measurements can correct for changes in the business cycle, they are frequently used when trying to judge the overall worth of a stock index.

    When determining if a company’s share price appropriately represents projected earnings per share, analysts and investors look at its P/E ratio.

    Forward Price-to-Earnings Ratios

    These two forms of EPS measures are used to calculate the two most prevalent P/E ratios: forward and trailing P/E. The sum of the last two actual quarters and the estimates for the future two quarters is a third, less typical form.

    Instead of using trailing figures, the forward (or leading) P/E employs future earnings guidance. This forward-looking measure, also known as “estimated price to earnings,” is useful for comparing current earnings to future earnings and for providing a clearer image of what earnings will look like—without modifications or other accounting adjustments.

    However, the forward P/E metric has flaws, such as firms underestimating earnings in order to surpass the predicted P/E when the next quarter’s results are released. Other corporations may overestimate their forecast and then adjust it in their next earnings report. Furthermore, outsider analysts may make forecasts that differ from those provided by the corporation, causing confusion.

    Trailing Price-to-Earnings Ratio (P/E)

    By dividing the current share price by total EPS earnings over the last 12 months, the trailing P/E is calculated. It’s the most often used P/E ratio since it’s the most objective—assuming the company honestly reported earnings. Because they don’t trust other people’s profits projections, some investors prefer to look at the trailing P/E. However, the trailing P/E has some flaws, one of which is that past performance does not always predict future behavior.

    As a result, investors should make investments based on future earnings potential rather than historical performance. It’s also a concern that the EPS number remains constant while stock values change. The trailing P/E will be less representative of those changes if a major company event sends the stock price much higher or lower.

    Because earnings are only reported once a quarter, while stocks trade every day, the trailing P/E ratio will alter when the price of a company’s shares fluctuates. As a reason, the forward P/E is preferred by some investors. Analysts expect earnings to rise if the forward P/E ratio is lower than the trailing P/E ratio; if the ahead P/E is greater than the current P/E ratio, analysts expect earnings to fall.

    As we mentioned earlier you need to have the right technologies to trade profitably. That is why you need the best online trading company that provides you with the best stock trading platform. We at Zebu are obligated to provide our traders with the best trading accounts so that they can invest with ease.