Tag: Financial Ratios

  • How to Compare a Company to its Peers while Investing

    When investing in the stock market, it is important to conduct thorough research and analysis in order to make informed decisions about which stocks to include in your portfolio. One important aspect of this analysis is comparing a company to its peers in the industry. By comparing a company to its peers, investors can gain a better understanding of how it is performing relative to its competitors and identify any potential strengths or weaknesses.

    Here are a few steps that investors can take when comparing a company to its peers:

    Identify the company’s peers: The first step in comparing a company to its peers is to identify which companies are its peers. This typically involves looking at companies that operate in the same industry or sector as the company in question. For example, if you are considering investing in a pharmaceutical company, you would want to compare it to other pharmaceutical companies.

    Gather financial data: The next step is to gather financial data on the company and its peers. This can include data on revenue, profitability, debt levels, and other key financial metrics. By comparing these metrics, you can get a sense of how the company is performing relative to its peers.

    Analyze the data: Once you have gathered the financial data, it is important to analyze it in order to identify any trends or patterns. This can involve looking at how the company’s performance compares to its peers over time, as well as how it compares in terms of key metrics such as revenue growth, profitability, and debt levels.

    Consider other factors: In addition to financial data, there are a number of other factors that you may want to consider when comparing a company to its peers. This can include things like the company’s management team, business model, and market position. By taking these factors into account, you can get a more complete picture of the company’s strengths and weaknesses.

    Use comparison tools: There are a number of tools and resources available to help investors compare companies to their peers. For example, many financial websites and software programs offer comparison tools that allow you to view financial data and other information on multiple companies side by side. These tools can be particularly helpful for investors who are looking to quickly and easily compare companies in different industries or sectors.

    In conclusion, comparing a company to its peers is an important step in the investment process. By gathering and analyzing financial data and other key factors, investors can get a better understanding of how a company is performing relative to its peers and identify any potential strengths or weaknesses. By taking the time to compare a company to its peers, investors can make more informed decisions about which stocks to include in their portfolio and increase their chances of long-term success.
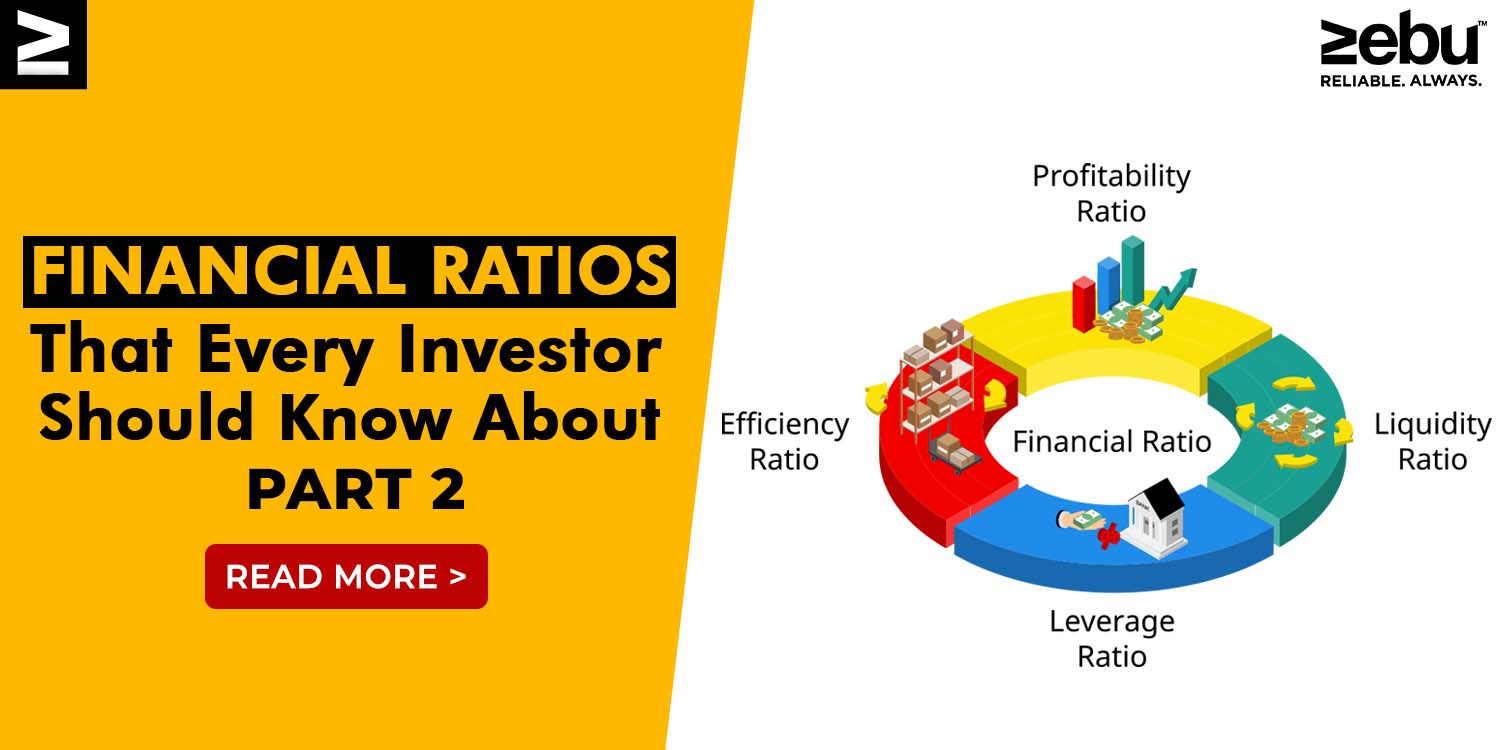
  • Financial Ratios That Every Investor Should Know About – Part 2

    In continuation of our series about important financial ratios that everyone should know about, here are a few more that will help you become a better investor.

    EV/EBITDA

    People often use the P/E ratio and the enterprise value (EV) by EBITDA to figure out how much a company is worth. Market capitalization plus debt less cash equals EV. It gives a much more accurate takeover valuation because it takes into account debt. This is its main advantage over the price-to-earnings ratio, which can be thrown off by very high earnings that come from debt, as we’ve seen. EBITDA stands for earnings before taking into account interest, taxes, depreciation, and amortisation.

    This ratio shows how much a business with a lot of debt is worth. As EV/EBITDA is not affected by the capital structure, it can be used to evaluate businesses with different amounts of debt. A lower ratio shows that a company is undervalued. It is important to note that the ratio is high for industries with fast growth and low for industries with slow growth.

    RATIO OF PRICE TO EARNINGS GROWTH

    The PEG ratio is used to figure out how the price of a stock, its earnings per share (EPS), and the growth of the company are all linked.

    A high P/E ratio is often a sign of a business that is growing quickly. This could mean that something is worth too much. The P/E ratio is divided by the expected growth rate to see if a high P/E ratio makes sense given the expected growth rate in the future. The end result can be compared to that of peers who grew at different rates.

    A PEG ratio of 1 means that the price of the stock is fair. If the number is less than 1, it could mean that the stock is undervalued.

    RETURN ON EQUITY

    The main goal of any investment is to make money. Return on equity, or ROE, is a way to measure how much money shareholders get back from the company’s operations and profits as a whole. Investors can use it to figure out how profitable businesses in the same industry are. Having a number is always better. The ratio shows how good the management is. ROE is the ratio of net income to shareholder equity.

    Even though businesses with a lot of growth should have a higher ROE, a ROE of 15-20% is still good. The biggest benefit is when earnings are put back into the business to make a higher ROE, which leads to a faster growth rate. But it’s important to keep in mind that a rise in debt will also lead to a rise in ROE.

    INTEREST COVERAGE RATE

    It is found by dividing interest costs by EBIT, which stands for earnings before interest and taxes. It tells how healthy a company’s finances are and how many interest payments it can make through its activities alone.

    When comparing businesses in different industries with very different depreciation and amortisation costs, EBITDA can be used instead of EBIT. Or, if you want a more accurate picture of a company’s ability to pay its bills, you could look at its earnings before interest but after taxes.

    CURRENT RATIO

    This shows the liquidity situation of the company, or how ready it is to pay its short-term debts with its short-term assets. If the number is higher, it means that working capital problems won’t affect how the company runs. Red flags go up when the current ratio is less than one.

    The ratio can be found by dividing the current liabilities by the current assets. Receivables and stock are examples of what are called “current assets.” Businesses can find it hard to turn receivables into cash and inventory into sales. This could make it harder for it to meet its obligations. In this case, the investor may look at the acid-test ratio, which is similar to the current ratio but doesn’t include inventory and receivables.

    ASSET TURNOVER RATIO

    It shows how well the management makes use of resources to make money. The better the ratio, the more money the business makes for every rupee it spends on an asset. The ratio is better if it is higher. Experts say that the comparison should be made between businesses that work in the same industry. This is because the ratio could be different in different industries. Asset-heavy industries like telecommunications and power have a low asset turnover ratio, while retail has a high one (as the asset base is small).

    DIVIDEND YIELD

    Dividends per share are based on how much each share is worth. If the number is high, that means the business is doing well. But penny stocks, which are low-quality but have high dividend yields, and businesses that sometimes make a profit or have extra cash they can use to pay special dividends should be avoided. In a similar way, a low dividend yield may not always mean that an investment is a bad one. For example, businesses (especially those just starting out or growing) may decide to reinvest all of their profits in order to give their shareholders good long-term returns.

    Financial ratio research helps evaluate things like profitability, effectiveness, and risk. Before investing in a stock, you should also look into the macroeconomic environment, the quality of the management, and the outlook for the industry.

  • Financial Ratios That Every Investor Should Know About – Part 1

    Before investing in a company’s stock, the financial parameters must be carefully looked at to find out what its real value is. Before you buy shares, you should think about the eleven financial ratios we give you.

    Before investing in a company’s stock, the financial facts must be carefully looked at to find out what its real value is. This is usually done by looking at the balance sheet, cash flow statement, and profit and loss account of the company. This can be hard and take a long time. It’s easier to learn about a company’s performance by looking at its financial ratios, most of which can be found online for free.

    This is a good way to quickly figure out how healthy a company is, but it is not a foolproof method.

    You should think about these eleven financial ratios before you buy a stock.

    P/E Ratio

    The price-to-earnings ratio, or P/E, shows how much investors are willing to pay for each rupee of earnings. It shows whether the market is putting too much or too little value on the company.

    The best P/E ratio can be found by comparing the current P/E to the past P/E of the company, the average P/E of the industry, and the P/E of the market. A company with a P/E of 15 may seem expensive when compared to its historical P/E, but if the industry P/E is 18 and the market average is 20, it may be a good investment.

    If the P/E ratio is high, the price of the stock may be high. A stock with a low price-to-earnings ratio may have more room to go up. P/E ratios should be used along with other financial ratios to help people make good decisions.

    PRICE-TO-BOOK Ratio

    The price-to-book value (P/BV) ratio compares the market price and book value of a company. Book value is simply the amount left over after a company sells all of its assets and pays off all of its debts.

    The P/BV ratio is used to figure out the value of a company’s shares if it has a lot of real assets on its balance sheet. If the P/BV ratio is less than 1, the stock is undervalued because the value of the company’s assets is higher than what the market is putting on the stock. It shows what a company is really worth and helps figure out the value of businesses with mostly liquid assets, like banks and financial institutions.

    DEBT TO EQUITY Ratio

    It shows how leveraged a company is, or how much debt it has compared to the amount of money its founders put into the business (equity). Most of the time, a low number is better. But it can’t be looked at by itself.

    The debt will be worth more if the company makes more money than it spends on interest. But if it isn’t, shareholders will lose.

    A business with a low debt-to-equity ratio may be expected to have a lot of room to grow because it has more ways to get money.

    But it’s not that simple. It varies by industry, with higher numbers in industries that need a lot of capital, like manufacturing and the car business. A high debt-to-equity ratio could be a sign to the market that the company has invested in a lot of high-NPV projects, but it could also mean that the company has a lot of debt and, therefore, a higher risk of credit default.

    A stock may be overpriced if its P/E ratio is high. A stock with a low price-to-earnings ratio may have more room to go up. P/E ratios should be used along with other financial factors to help make good decisions.

    OPERATING PROFIT MARGIN (OPM)

    The OPM is good at setting prices and running its business well. It is found by dividing the operational profit by the net sales. A higher OPM shows that it is efficient to get raw materials and turn them into finished goods.

    It figures out how much money is left over after paying for variable costs like salaries and raw materials. The margin is bigger the better it is for investors.

    When analysing a company, check to see if its OPM has been going up over time. Investors should compare the OPMs of different companies in the same business sector.

  • RoE Vs RoCE – The Values You Should Know Before Investing

    When it comes to financial ratios, there is no such thing as the best measure. Each ratio has its own advantages and disadvantages. Two of the most common ratios are the Return on Equity (ROE) and the Return on Capital Employed (ROCE). The first is valuable from the point of view of equity shareholders, while the second is important from the point of view of how a company uses its capital. First, let’s explain the difference between ROE and ROCE. When comparing return on capital to return on capital employed as a way to judge a company, which is the better statistic? ROE or ROCE? Which is better? First, let’s look more closely at how ROE and ROCE are used.

    ROE

    Return on equity is one of the most popular ways to figure out how much money shareholders made (ROE). When you put money into an investment, you want to know how much money it is making. Shareholders get dividends out of the company’s profits as they come in. After paying dividends, any money left over is added to the business’s net worth. ROE is important because it shows investors that the money that is being put back into the business is still making a good return. The business can do one of two things with the money it makes. First of all, by giving dividends to shareholders, it reduces the company’s wealth. The second plan is to put the money back into the business for internal use. If a company decides to reinvest profits instead of giving them out as dividends, it must show a strong return on equity (ROE) to support this decision.

    ROE is very vulnerable because the business needs capital and depends on capital assets. For example, telecommunications and oil, which require a lot of capital, tend to have low ROEs. On the other hand, information technology and fast-moving consumer goods have a better return on equity and need less capital. ROE and P/E ratios, which are used to value stocks, usually go together well. Most of the time, sectors with higher ROEs have higher P/E ratios. To put it another way, most FMCG companies in India are worth more than mining, metals, telecom, and oil extraction companies because they have more assets. Companies with a high return on equity usually have few assets and little debt.

    ROE is calculated by dividing net income by net worth (Equity)

    The company’s net worth is made up of its base equity capital and its free reserves, which were made with money from the company’s profits. ROE not only measures how much value the company leaves for its shareholders, but it also measures how well the organisation uses the profits that are put back into the business.

    ROCE

    Before you can understand what ROCE is, you have to know what ROE is not. ROE only looks at returns from the point of view of equity shareholders. But there are also other people who have a stake in the company, such as lenders, bond and debenture holders, etc. We need to know how much money the company makes for its owners. You could say that these people have something to gain. That’s great, but how do I decide if I want to buy the debt of a company or not? This is done by looking at the business’s ROCE.

    The ROCE ratio shows how much a company makes from its operations compared to how much capital it uses. What is operational profits? It shows how much money was made after depreciation but before interest and taxes. Even if you say that depreciation is not a cost, the tax shelter from depreciation will be used to make up for it. In that way, it is a cost of doing business. When we talk about capital used, both long-term debt and equity are included. There are two ways to look at the use of capital. First, equity, free reserves, and long-term loans can all be thought of as long-term sources of funding. Another option is to look at the total assets that are not covered by current liabilities (total assets – current liabilities). The following can be used to model ROCE:

    EBIT + ROCE = Earnings Before Interest and Taxes + Return on Capital Employed (Total Assets – Current Liabilities)

    The numerator is the company’s operating profits, and the denominator is its long-term capital in the form of equity and debt. In light of the ROE, how should the ROCE be understood? Let’s look at a really interesting case.

    Which measure of return, ROE or ROCE, is better?

    The main point is that from the point of view of shareholders and figuring out where the P/E Ratio is going, ROE is more important. But when you look at the company as a whole, ROCE is better.

  • Number-based Rules For Investing

    A few rules about investing could help us figure out how quickly our money grows or loses value. Then, some rules help us decide what to do with our money. For instance, how should we divide up the money in our mutual funds? How much should we save for retirement and emergencies?

    We’ve made a list of general tips to keep in mind when making decisions about money or investing.

    Are you looking for the best trading platforms? Then your search ends here. At Zebu, a share broker company we offer our users the right online trading platform and the best trading accounts.

    7 RULES OF INVESTING

    To quickly understand how much money is worth, you need to know the first three thumb rules.

    RULE OF 72

    Everyone wants their money to double in value and is looking for ways to make that happen as quickly as possible. The rule of 72 gives you an estimate of how many years it will take for your money to double.

    If you divide 72 by the expected rate of return, you may get a very accurate estimate of how long it will take for your money to double using this method. Let’s look at an example to see how this rule works. Let’s say you put Rs 1 lakh into something that gives you a 6% return. If you take 72 and divide it by 6, you get 12.

    That means that in 12 years, your Rs. 1 lakh will be worth Rs. 2,00,000

    It’s important to remember that this rule only applies to assets that pay compound interest.

    You can also use the Rule of 72 to figure out how much interest you’ll need in a certain amount of time to double your money. For example, if you want your money to double in 5 years, you can find the interest rate by dividing 72 by the amount of time it takes to double. I.e., 72/5= 14.4%p.a. So, for you to get twice as much, you should get 14.4% p.a.

    RULE OF 114

    Using the same reasoning and math formula, the investing rules of 114 can give you a pretty good idea of how many years it will take for your investment to triple.

    Rule 114 says that if you invest 1 lakh at 6% p.a. for 19 years, it will grow to 3 lakhs.

    Similarly, if you want your money to triple over the next five years divide 114 by 5, which gives you a rate of interest of 22.8% per year for your money to triple in 5 years.

    RULE OF 144

    Rule 144 is the next rule of thumb to keep in mind when investing in a mutual fund. Rule 72 times 2 is 144. The “rule of 144” tells you how much time it will take to quadruple your investment.

    Rule 144 says that if you put Rs 1 lakh into a product with a 6% interest rate, it will be worth Rs 4 lakh 24 years later. So, to find out how many years it will take for the money to grow four times, just divide 144 by the interest rate of the product.

    100 MINUS AGE RULE

    The 100-minus-age rule is a great way to figure out how to spend your money. That is, how much of your money should go into equity funds and how much should go toward paying off debt.

    This investment rule says that you should take your age away from 100. The number you get is the right amount of equity exposure for you. The rest of the money can be used to buy debt.

    Say, for example, you are 25 years old and want to invest Rs 10,000 each month. If you follow the 100 minus age rules for investing, 75 percent of your money will be in stocks (100 – 25). Then you should put Rs 7,500 into stocks and Rs 2,500 into debt. Using the same rule, if you are 35 years old and want to invest Rs 10,000, you should put 100 – 35 = 65% of your money in stocks. So, you should put Rs 6,500 into stocks and Rs 3,500 into debt.

    RULE FOR A MINIMUM INVESTMENT OF 10%

    This rule of thumb says that investors should start by putting away at least 10% of their current salary and then increase that amount by 10% each year as their salary increases. To make the most of the power of compounding, you should start investing as soon as possible. Investing early will help you make the most out of it.

    EMERGENCY FUND RULE

    Like the rule about investing at least 10% of your income, you must put some of your salary into the emergency fund. You need to have money saved up because you never know what life will throw at you. So, you should save money for emergencies before you start investing. According to this rule, you should save enough money to cover your monthly costs for at least three to six months.

    In case of an emergency, you need to be able to get to your emergency fund, and it’s best to keep it liquid so you don’t run out of money.

    RULE OF 4% WITHDRAWAL

    Stick to the 4% rule if you want your retirement fund to last long. If you follow this rule as a retiree, you will have a steady income. But at the same time, you have enough money in the bank to make enough money.

    For example, if you have a retirement fund of Rs. 1 crore, you should take Rs. 4 lakh every year, or Rs. 33,000 every month, to keep up with inflation.

    SUMMING UP

    The rules of thumb listed above are general rules and guidelines that every investor should follow. A good investor is careful, so before you start, you should do your research and talk to someone who knows about investing. That’s why it’s important to stress that these rules shouldn’t be followed without question. Keep in mind that a good investment portfolio helps you reach your financial goals while taking your risk tolerance and time horizon into account.

    At Zebu, a share broker company we offer our users the right online trading platform and the best trading accounts.

  • Fundamental Analysis 101 – 5 Things To Get You Started

    Fundamental analysis is about getting to know a company, its business, and its future plans better. It includes reading and analysing annual reports and financial statements to get a sense of the company’s strengths and weaknesses, as well as its competitors.

    Before you get started on your journey of investments, we believe that you deserve one of the best trading accounts from one of the top brokers in share market. With Zebu, you get access to a state-of-the-art online trading platform with which you can perform comprehensive fundamental and technical analysis.

    A few of the important parameters while doing fundamental analysis are:

    1. Net Profit
    Net profit can mean different things to different people. Net means “after all the deductions.” It’s common to think of net profit as profit after all the operating costs have been taken out, especially the fixed costs or overheads. Gross profit gives investors the difference between sales and direct costs of goods sold before operating costs or overheads are taken into account. This is not the case here. It is also called Profit After Tax (PAT), which is the profit figure that is left after taxes are taken out of the profit.

    2. Profit Margins
    The earnings of a company don’t tell the entire story. Earning more money is good, but if the cost goes up more than the revenue, the profit margin doesn’t get better. The profit margin shows how much money the company makes from each rupee of sales. This measure is very useful when you want to compare businesses in the same industry.
    On the basis of a simple formula:
    Net income / Revenue = Profit margin
    In this case, a higher profit margin means that the company is better able to control its costs than its competitors are. The profit margin is shown in percentages.
    If a company makes 10 paise for every rupee they make, then the profit margin is 10%. This means that the company makes 10 paise for every rupee they make.

    3. Return on Equity Ratio
    Return on Equity (ROE) shows how well a company does at making money. It is a ratio of revenue and profits to the value of the company’s stock. Find out how much profit a company can make with the money its shareholders have put into it. A simple way to do this is to look at the return on equity ratio,

    The Return on Equity Ratio is calculated as shown.

    Return on equity = Net Income / Shareholder’s Equity

    It is calculated in rupees.

    This factor is important because it tells you about a lot of other things, like leverage (debt of the company), revenue, profits and margins, returns to shareholders.

    For example, a company called XYZ Ltd. made a net profit (before dividends) of Rs. 1,00,000. During the year, it paid out dividends of Rs. 10,000. XYZ Ltd. also had 500, Rs.50 par common shares on the market during the year, as well. That’s how the ROE would be calculated then.

    ROE = 1,00,000–10,000/500*50 = Rs. 3.6.

    Simply put, those who own shares in the company will get back Rs. 3.6 for every rupee they invest in the company.

    4. Price to Earnings (P/E) Ratio

    People often use the Price-to-Earnings (P/E) ratio to figure out how much a share of a company is worth. It tells us how much money the company makes per share in the market today.
    We can figure out the Price of earnings, or PE ratio, as shown below.
    In simple terms, PE = Price per Share / Earnings per Share
    This also helps when you want to compare businesses. Then companies should figure out their EPS and then figure out how much their PE ratio value is.
    A high P/E means that the stock is priced high compared to its earnings. Companies with higher P/E seem to be more expensive. However, this measure, as well as other financial ratios, must be compared to other companies in the same industry or to the company’s own P/E history to be useful.
    If company XYZ has a share that costs 50 rupees, and its earnings per share for the year are 10 rupees per share.

    The P/E Ratio is 50/10, which is 5.

    5. Price-to-Book (P/B) Ratio
    A Price-to-Book (P/B) ratio is used to compare a stock’s value on the market to its value on the books. Calculating the P/B ratio is the way to figure out if you’re paying too much for the stock because it shows how much money the company would have leftover if it were to close down today.
    P/BV Ratio = Current Market Price per Share / Book Value per Share
    Book Value per Share = Book Value / Total number of shares
    Having a higher P/B ratio than 1 means that the share price is higher than what the company’s assets would be sold for, which means that the share price is higher. The difference shows what investors think about the future growth of the company.

    XYZ company, for example, has 10,000 shares trading at Rs.10 each. This year, the company recorded a net value of Rs. 50,000 on its balance sheet. The price-to-book ratio of the corporation would be as follows:

    50,000 / 10,000 = Book Value per Share

    P/BV Ratio = 10 / 5

    P/BV Ratio = 2

    The company’s market price is two times its book value. This signifies that the company’s stock is worth twice as much as the balance sheet’s net worth. Also, because investors are ready to pay more for the business’s shares than they are worth, this company would be called overvalued.

    Zebu is the house of the best online trading platform in the country – as one of the top brokers in share market, we have provided the best trading accounts for our users. Think of the most complex analysis that you need to do and Zebull Smart Trader from Zebu will make it possible for you. If you would like to know more, please get in touch with us now.