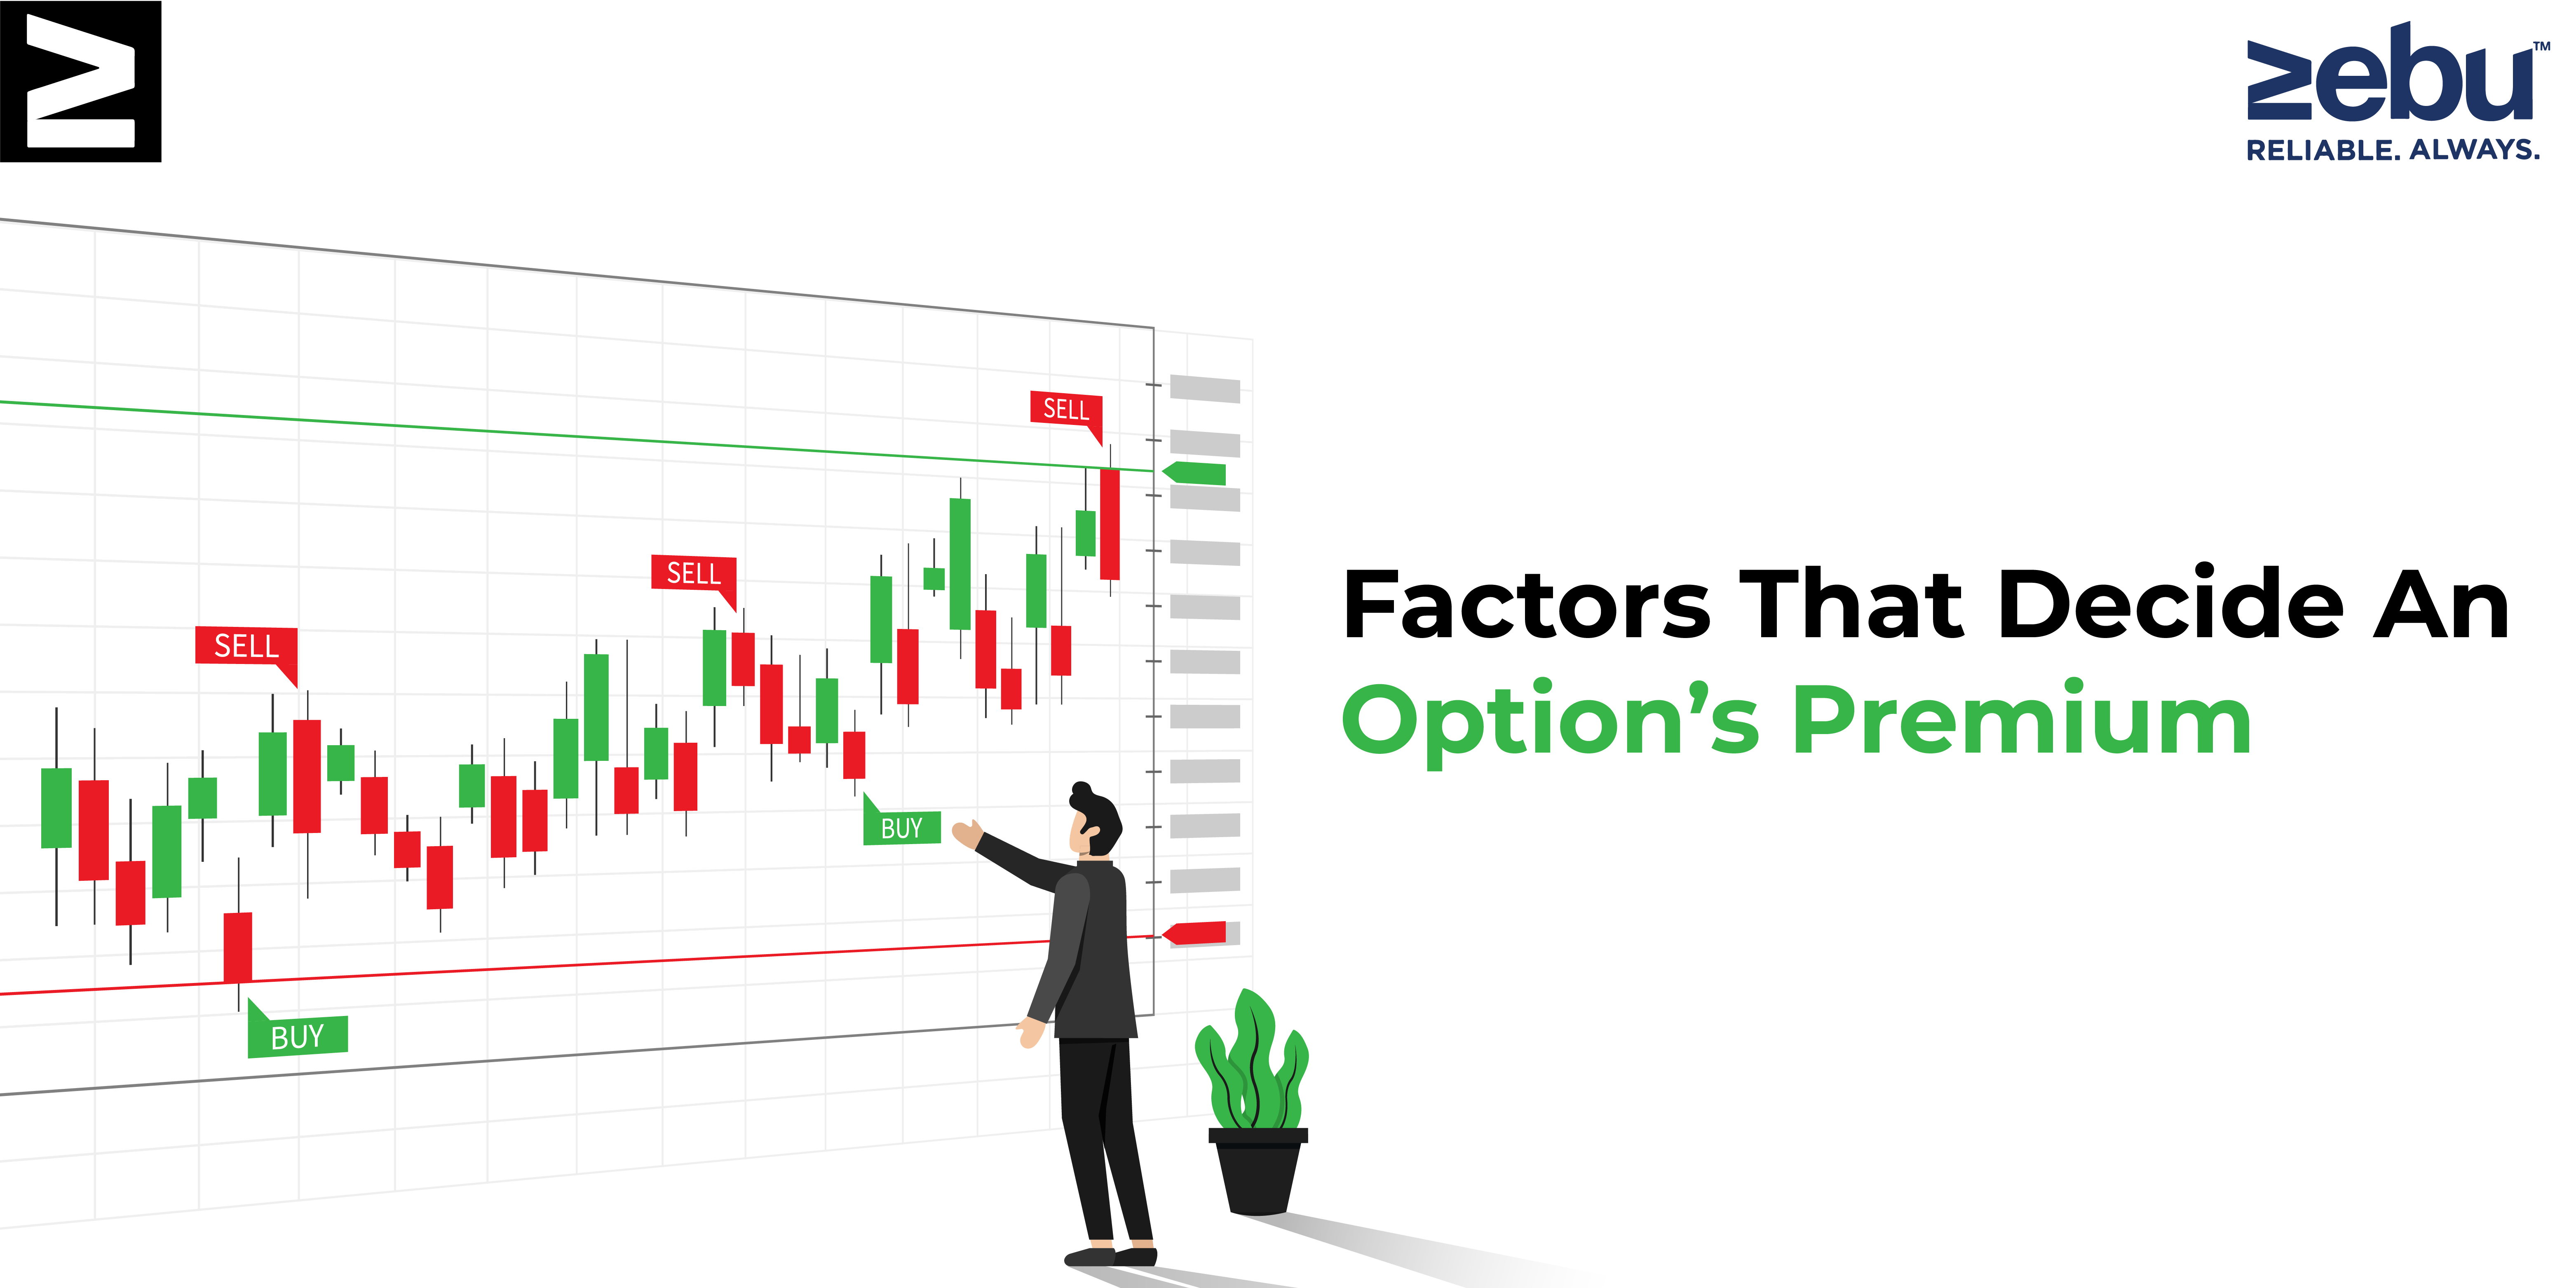
Factors That Decide An Option’s Premium
Any trader will tell you that in order to be successful, you have to understand and, more importantly, master the concept of option pricing and how to figure out its correct value.
When you look at all the things that affect an option’s price, you can figure out what its real price is. Let’s look at oil as an example. The final prices of petroleum depend on consumer demand, the price of crude oil, the time of year, local and state taxes, refinery output, etc. If you want to know or figure out the price of an option before you buy or sell it, you can use a mathematical model like the Black Scholes model. You only need to think about the different parts of the model to figure out the right price.
Being a successful trader depends on several things, but most importantly it depends on the kind of platform you use to trade. As a stock broker, we understand this and offer the best trading platform to our users that provides them with the best trading accounts.
Putting a price on an option depends on a number of things.
The stock’s current price: If you’re interested in a call option that lets you buy shares of X company for, say, Rs 350 each, you’d probably be willing to pay more for that call when the stock is trading at Rs 320 instead of Rs 350. This is because the call option gets much closer to being ITM at Rs 49 than it would have been if it traded at Rs 40. Put options, on the other hand, do the opposite.
The Strike Price: This is the price that a call owner has to pay to buy stock, while a put owner has to pay if he wants to sell his stock. This is like the example that was given above. Most of the time, it costs more to get the right to buy stock at Rs 350 than at Rs 380. The average investor would, of course, like to have the right to buy stocks at lower prices at any time of day. With the strike price going down, this makes calls cost more. In the same way, the value of puts goes up when the strike price goes up.
Time before expiration: It’s important to remember that all options have a set amount of time they can be used and usually end on or after a certain date. Because of this, the value of an option goes down as time goes on. The more time there is until expiration, the more likely it is that you can make moves that will make you money.
Interest rates: This is not a very important factor when figuring out the price of an option. When interest rates go up, so do the prices of call options. When the trader chooses the call option instead of the stock, any extra cash in his account should, at least in theory, earn him interest. This doesn’t really happen in the real world, but the basic idea makes sense.
Dividends: When a stock trades but the owner doesn’t get any dividends, this is called “ex-dividend,” and the price of the stock goes down by the amount of the dividend that was due. When dividends go up, put values go up and call values go down.
Volatility is thought to be the most important variable. In simple terms, volatility is the difference between the prices of stocks from one day to the next. It can also be called swings in the price of a stock. When compared to stocks that are less likely to change, volatile stocks are more likely to have a different strike price level. When investors make big moves, their chances of making money go up. So, options on stocks that change a lot are definitely more expensive than options on stocks that change less or not at all. So, it’s important to remember that even small changes in estimates of volatility have a big effect on the prices of options. Volatility is usually thought of as an estimate, and if you only have an estimate, especially of future volatility, it’s almost impossible to figure out the right option value.
As we mentioned earlier being successful as a trader depends on several things, but most importantly it depends on the kind of platform you use to trade. As a stock broker, we understand this and offer the best trading platform to our users that provides them with the best trading accounts.