Investing is the most important way to build wealth and you don’t need to be an expert in the share market to be profitable. If you are unsure of how to choose the right stocks, you can always hand over the burden to the experts and simply invest in mutual funds. If you stay invested even for 20 years with an approximate return of 12% per annum, you can not only beat inflation but also create an immense amount of wealth. If you are just starting out on your first job, invest as much as you can spare and keep increasing the amount with every hike that you get. Here are 5 important aspects you should know before starting your investment journey.
Risk and Return
When it comes to investing, Risk and Return are closely linked. The larger the risk, the higher the possible return. You should never chase high-return investments on a whim. Consider your investing aim, time horizon, and risk tolerance. Always invest in something that is right for you.
Diversification of risks
Any investment entails some level of risk. You can’t prevent it, but you can limit the odds of big losses by managing your risk exposure with the correct strategy. Diversifying your investments and spreading your risk is the simplest and most effective method. Diversifying your investments across asset types, such as equities, bonds, and savings, is a good way to go.
Consistency
By committing to a consistent schedule for investing, say monthly, you can limit the risks of loss due to sharp moves on either side. Identify quality stocks and invest in them every month for good, long-term returns. ,b>Compound Interest Because the interest generated grows your principal (the money you put in), you obtain a bigger return. It’s a snowball effect: the longer you invest, the more compound interest benefits you. As a result, it is critical to begin saving and investing as soon as possible.
Inflation> Inflation has been a constant in Hong Kong for the past few decades. Your investment must have a return rate that is equal to or greater than inflation. If you don’t, your money will lose value.
Knowing how much it costs to raise a child and how much joy it brings isn’t always easy to compare, but it’s smart to know and plan for these costs. In general, it costs a lot to raise a child, from the time it is born to when it goes off on its own. It costs between 1.5 and 2 crores. When you think about how much it costs to raise a child now, having two kids makes sense.
At different points in a child’s life, there are some costs that need to be paid. These are some of them. In light of the current trends, these costs are based on averages.
Trading or investing can be a difficult journey without the right tools. That’s why you need the best Indian trading platform with a wide range of features. With Zebu, one of the best stock brokers in the country, your online stock trading journey will be drastically enhanced.
Expenses at different stages of life
There is a lot of money spent on medicines and vaccines in the first year after the birth of a child in urban and semi-urban areas. A playgroup or creche costs a lot of money when a child turns two. This could cost anywhere from 50,000 to 1 lakh, depending on how many amenities the creche has to offer. In the early years of a child’s life, the cost of toys and clothes is big because they tend to grow out of them.
School expenses: Based on recent trends, it looks like more than half the population of parents spend more than half their annual income to pay for their children’s education and hobbies. There are times when parents have trouble making ends meet because the cost of school has gone up. A good school charges a fee of 50,000 to 2 lakh for the whole year. Expenses for the 12 years from classes I to XII would be between 11 lakh and 43 lakh if annual education costs rose by 10% each year. In addition to any tuition or extra-curricular activities that the child will be paying for, this fee will be added on as well.
Higher studies: Suppose that the average cost of going to school for engineering is about 10 lakh today. In about 15 years, the same thing would cost 40 lakh to 50 lakh, too. The same thing goes for medical degrees. If they cost 25 lakh now, it’s a safe bet that they will cost more than 1 crore in the next 15 years. Even though parents can take out loans to pay for their kids to go to school, the interest rate is still high, even after tax breaks.
Besides paying for their kids’ education, a family might have to spend money to make their home more private for their grown-up kids. Entertainment costs have also gone up a lot, especially in cities. There are birthday parties to plan, birthday gifts to buy, school cultural events, gadgets, hobbies to keep track of, and so much more to think about.
In light of the above outflows, it is important for parents to plan their finances so that they don’t spend more than they need to and aren’t able to save for their own retirement. There are also safety nets that need to be put in place, like getting enough insurance and setting up an emergency fund.
To make sure that you have a retirement fund, you can assume that you have a third child and every time you spend on your first two children, you can invest the same amount for the imaginary third child and invest it in a mutual fund. With a return of around 12-15% per annum, you will be left with a substantial corpus. You can use this as your retirement fund and can enjoy your golden years with enough funds.
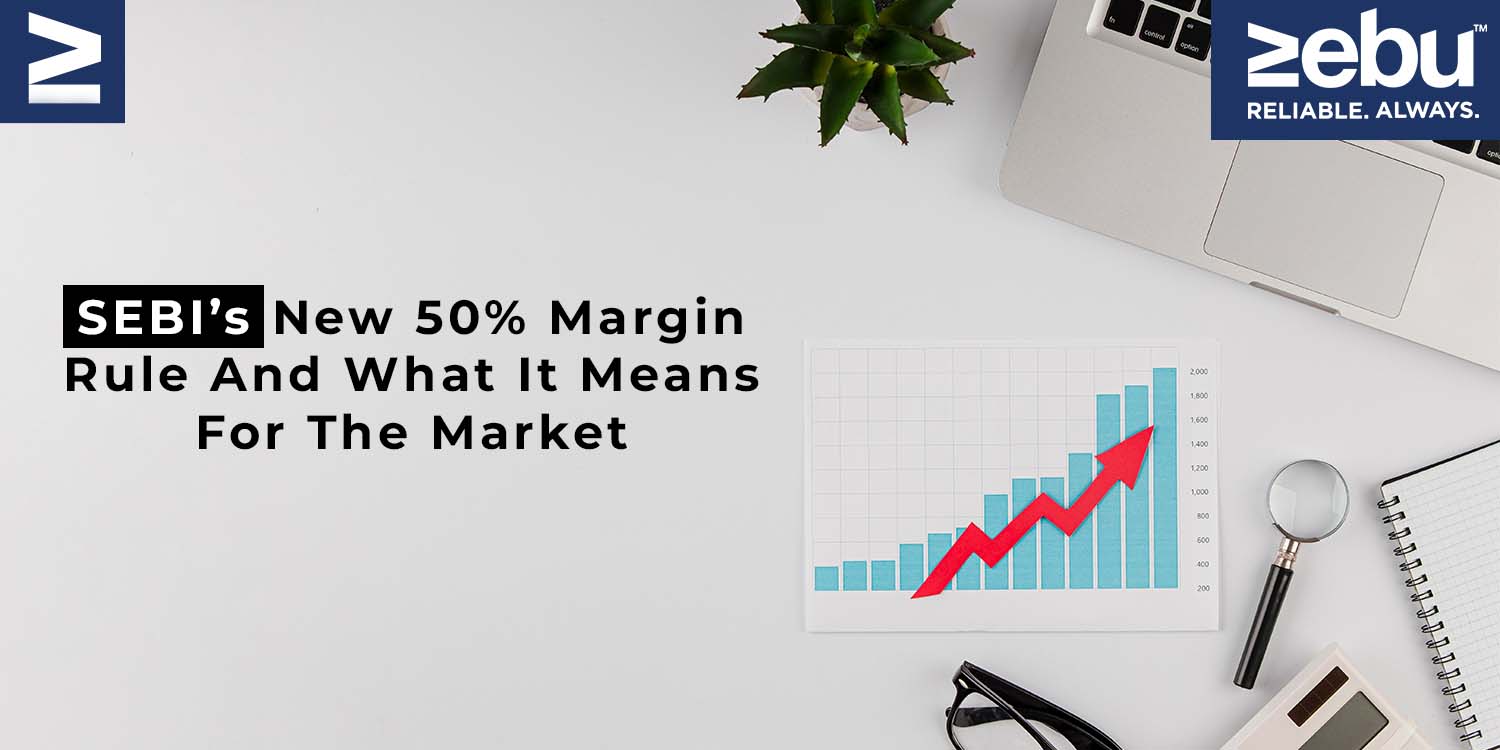
The Securities and Exchange Board of India (Sebi) announced in November that the framework for segregation and monitoring of collateral at the client level will be implemented on May 2, 2022. Following repeated appeals from parties to the market regulator, the deadline was extended to May 2nd.
The rule was supposed to go into effect on December 1, 2021, but it was pushed back to February 28, 2022, and then to May 2nd, 2022.
SEBI says that they are introducing this 50% margin rule for futures and options trading to limit risks in the system.
This rule was proposed after a popular stockbroking company illegally used their clients’ shares as collateral against a loan.
Market experts applauded the deadline extension, saying that more time would help all intermediaries prepare for the new margin rules. Since there will be a lot of changes in technology and operational processes, this extra time has assisted all intermediaries in properly gearing up.
Even though the deadline is coming into effect today, several brokerage firms have implemented this 50% margin rule even before that for futures and options trader.
The clauses outlined procedures for collateral deposit and allocation, collateral value, change of allocation, margin blocking, collateral withdrawal, and default management.
In a recently released circular, the regulator highlighted investor interest, market regulation, and development as reasons for the postponement.
Previously, investors could use their securities to completely cover their margins. However, from today, they will be required to hold 50% of the value in cash in their account as margins in order to trade in these categories.
During times of strong market volatility, stress, and a bull run, this is primarily to protect investors from big swings, as well as the high risks and pitfalls of leverage.
However, many people have raised concerns about the regulation’s negative aspects. According to them, this can lead to a reduction in market liquidity and possibly upend the market’s core price-discovery mechanism. Many brokers and traders believe that both results might have a big impact on market volumes.
Market emotion can be gauged using a derivative indicator known as the Put-Call Ratio (PCR). Both a “call option” and a “put option” provide buyers the right to buy or sell a specific asset at a specific price, respectively.
On any given day, the open interest in both a put contract and a call contract is combined to calculate the PCR.
A rising Put-Call Ratio, also known as a PCR, indicates that put contracts have a bigger open interest than call contracts. Traders are either negative on the market or using put options to protect their holdings from potential losses.
There is greater open interest in call contracts than put contracts if the Put-Call Ratio or PCR falls below 0.5. This is a sign that investors are bullish on the market as a whole.
A Put-Call Ratio of 1 shows that there are as many people interested in purchasing put options as there are in purchasing call options.
Considerations that should be taken into account Investors can use the put-call ratio to get a sense of market sentiment before a market shifts. Aside from this consideration, it’s vital to examine demand for both numerator and denominator (puts and calls).
The denominator of the ratio contains the number of call options. In other words, a decrease in the number of calls exchanged will raise the ratio’s value. Reduced call purchases without an increase in puts can raise the ratio. This is significant. To put it another way, the ratio doesn’t have to climb dramatically in order for it to do so.
As more bullish traders remain on the sidelines, the market becomes more negative as a result. However, this does not necessarily mean that the market is bearish, but rather that the market’s bullish traders are waiting for a future event, such as the impending elections or RBI meetings.
A Sign of Unpredictability:
In India, the Put-Call Ratio is a common Contrarian Indicator. The market is due for a trend reversal if the readings are excessively high or low.
Market players are overly pessimistic, and the market trend is likely to turn around soon. Similarly, exceptionally low levels signal that market participants are overconfident, and the market could turn red shortly if this trend continues.
In finance, words like Face Value, Book Value, and Market Value are used very often to determine the value lowest brokerage e of a company. There is a lot of confusion about these terms, and some people think they’re all the same. Is it possible for them to be used interchangeably, and if not, what is the difference between their book values and face values?
When it comes to stock selection, do these terms really make a difference?
If you are someone who trades or invests regularly then you understand the importance of using the right technology. We at Zebu, as one of the best share broker in the country, offer an online stock trading platform with lowest brokerage for intraday trading best suitable for full-time traders and investors.
Face Value
Face Value During the earliest phases of the offering, the value of a company’s common stock is calculated and recorded on the balance sheet. Original cost might be referred to here. However, it is not an accurate representation of the market value.
For example, the stock’s FV does not fluctuate and changes when a corporation goes through a stock split. In splitting the stock, the face value is taken into consideration rather than the market value. There are many different ways to split a stock, such as a 1:2 split, which will result in a change in the stock’s face value. As a result, the stock market’s value is likewise altered.
Dividends are calculated per share or per percentage of the face value of the share. As an example, if the dividend is declared to be 80 percent and the stock has a face value of Rs 10, each share will receive Rs 8. As a result, investors should always focus on dividend amount rather than dividend % when evaluating a company.
Face Value is based on the following two factors: Equity share capital and outstanding shares
Equity share capital divided by the number of shares in issue equals the “face value.” As a result, the face value of each share is nothing more than the amount of equity stockholders have invested. It’s a theoretical number that doesn’t change.
Book Value
The term “book value” refers to the value of a company’s books (accounts) that is reflected in its financial statements or net worth. If all the firm’s assets are sold and all of its liabilities are repaid, this is what the company is worth. The Free equity of a company, to put it another way, is reflected in this metric. The fluctuation in Book Value is extremely rare and occurs just once a year as a result of the company’s overall performance.
Using BV, you can see if the stock of a company is overvalued, undervalued, or just right. A company’s book value must be adjusted if it has a component of minority stake that is profit in the books due to a sister business under it.
(i) Book Value = Total Assets – (Total Liabilities – Current Liabilities)
(ii) Book Value per share = Face Value + Reserve per share
Book Value and Face Value are linked in the second formula.
There are few drawbacks to book value, such as the fact that it is disclosed on an annual basis. An investor won’t know the company’s book value has changed over time until after the reporting. There may be revisions to this accounting item that are difficult to understand and estimate. It is not effective for businesses that rely largely on human capital because only tangible assets are considered in the computation of book value.
Market Value
It is possible that the stock’s market value does not correspond to its fair value, which is determined by the stock’s current price on the exchange. It’s a measure of how much a business is worth. When the stock market fluctuates, so does MV. In the short term, it is influenced by the mood of the market, but in the long run, it is determined by the results of the company’s operations. It is the price at which we buy or sell the shares on the open market. Consequently, this is the most critical information for stock trading. This formula is used to determine a company’s market value.
Market Value = Current Stock Price * Number of shares outstanding
Market capitalization (MV) is another name for MV.
Both tangible and non-tangible assets are taken into account when determining market value. Market value, on the other hand, is based on a shaky foundation. The market value of a firm can be affected by a variety of factors, including profitability, performance, liquidity, and even simple news. As a result, one might conclude that a company’s market value represents its current trend.
Market vaue Vs Book Value If the stock is overvalued, undervalued, or just right, investors analyse the Book Value and Market Value.
If the market value of a firm is lower than its book value, this implies that the market has doubts about the company’s future. Or, to put it another way, investors believe that the company isn’t worth what it’s worth on paper, or that future earnings will be insufficient. Value Investors, on the other hand, are on the lookout for such businesses because they believe the market is overvaluing them.
If the market value of a firm is more than its book value, this shows that it is being valued more highly by the market. Therefore, investors expect that the company’s book value will rise in the future due to its good potential for growth, expansion, and increased earnings. Such businesses are considered attractive by investors. Stocks that are already trading at a high price may also be considered overvalued or overbought.
As mentioned earlier If you are someone who trades or invests regularly then you understand the importance of using the right technology. We at Zebu, as one of the best share broker in the country, offer an online stock trading platform with lowest brokerage on intraday trading best suitable for full-time traders and investors.
The term “rollover” refers to the process of transferring a near-expiring front-month contract to a futures contract in a further-out month. What this means is that you’ll close out your current contract and open a new one in the same time frame.
The expiration date of any futures contract or option you purchase will be clearly marked on the contract (last day until which you can trade that contract). So, for example, you can only trade the Nifty 28th August future until August 28th.
If you want to hold your position till September, you will need to sell your August Nifty futures and buy a new September futures contract, which will be valid until September 29. Rolling over refers to the act of transferring from one month’s pay to the next. Before the market closes on August 28th, you can perform this rollover at any moment.
So, for example, if you bought Nifty August futures at 17070 and imagine Nifty futures is 17000 on 20th August, you now opt to roll over your position to September since you want to continue your nifty futures purchase position. This means that the Nifty August future will be sold and you will instead purchase the Nifty March future, which you can now hold until March 29th.
You must pay brokerage and costs when you sell the August futures and you must pay brokerage and charges again when you buy the September futures. As with a typical buy-and-sell, there are fees involved.
This SEBI circular and comments from the exchanges state that rollover of contracts during the ban period is not permitted. In the event that you hold a contract job that is currently in a ban, you will only be able to exit that contract.
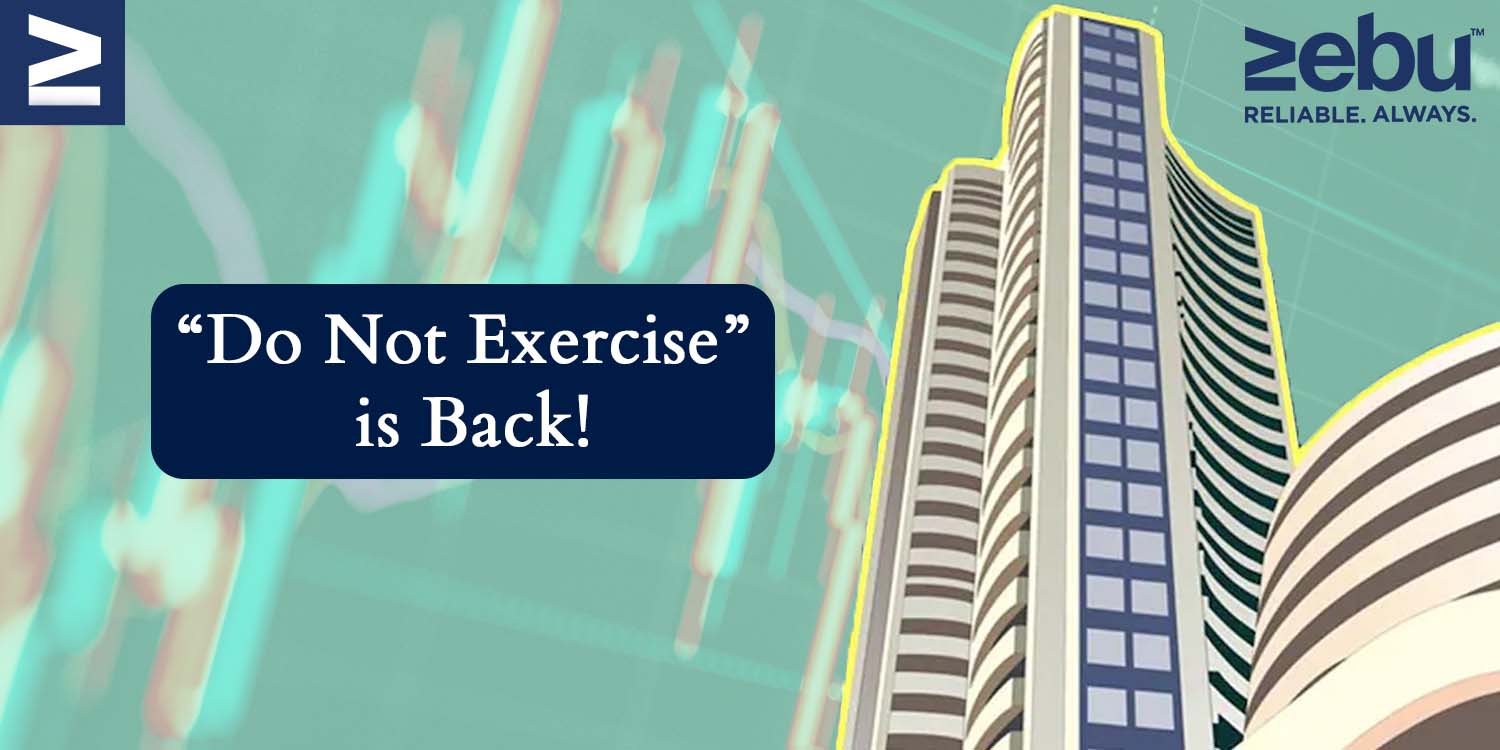
With immediate effect on April 28th, 2022, the National Stock Exchange of India (NSE) will reinstate the “Do Not Exercise” option in stock option contracts, providing much-needed respite to stock traders.
There will be a mandatory physical settlement of stock derivatives in October 2019, according to SEBI. To put it another way, if you have an open position in a stock option contract on the expiration day, you will have to deliver/take stock when the option is exercised. Only if the contract is ITM (In-The-Money) at the time of expiration can it be executed.
Are you a regular trader? Then choose Zebu’s online trading platform for analysis and make your trading journey seamless. As an online trading company we ensure our customers are benefited from our lowest brokerage for intraday trading options.
Some traders have the option to make a ‘Do Not Exercise’ request (DNE) in order to avoid exercising their entitlement to give or receive delivery. However, this option will no longer be available after October 2021.
On October 14, the final remaining ‘Do Not Exercise’ facility was shut down.
Some options traders who were unable to close their open positions on the expiry date as a result of NSE’s action burned their fingertips when they had to settle their shares physically on the expiry date.
Depending on the form of option, option holders were virtually required to either take or give physical delivery of the underlying share.
The option buyers, who pay a specified sum known as a premium, have the ‘right’ to buy or sell a stock at a specific price on a specific date or by a specific date, were the most impacted by this change. With the notion that their liability is limited, these traders found themselves caught off guard when their “right” to buy or sell had turned into their “obligation” to take or give delivery of the shares.
In order to protect traders who are unable to close down their holdings before the expiry date, the ‘Do Not Exercise’ option has been reinstated.
Choose Zebu’s online trading platform for analysis and make your trading journey seamless. As an online trading company we ensure our customers are benefited from our lowest brokerage for intraday trading options.
Venture capital, private equity, hedge funds, and managed futures, are some of the investments that can be made in an alternative investment fund. To put it another way, an AIF is a type of investment that does not fall under the traditional categories of equities, debt securities, and so on.
In contrast to Mutual Funds, which require a lower investment amount, Alternative Investment Funds tend to attract high-net-worth individuals and institutions.
Before getting into understanding Investment Funds, if you are keen on investing or trading you should always have the right tools that can support your investment journey. At Zebu, as a reputed share broker we have the best lonline trading platform and offer lowest brokerage for intraday trading.
Alternate Investment Funds Types According to the SEBI, AIFs fall into one of three basic categories.
Category 1:
Small and medium-sized firms (SMEs) and other startups with strong development potential that are also considered to be socially and economically viable fall under the purview of Category I investment funds. They have a multiplier effect in terms of growth and job generation and are encouraged by the government to invest. Those funds have been a lifeline for firms that were already flourishing but lacking in funding.
The following funds are included in Category I:
Venture Capital Funds Funding for start-ups with great growth potential but a lack of capital to start or develop their firm is provided through Venture Capital Funds (VCF). For new enterprises and entrepreneurs, Venture Capital Funds are the preferred method of raising financial because it is difficult to raise funds through the capital markets.
Venture capital funds (VCFs) bring together money from investors who wish to invest in start-ups. According to their business profiles and assets, they invest in a variety of startups at various stages of development. A venture capital fund focuses on early-stage investments, unlike mutual funds or hedge funds. Depending on the amount of money spent, each investor receives a piece of the company.
VCFs are favoured by HNIs looking for high-risk, high-return investment opportunities. Foreign HNIs can now invest in VCFs and help the economy flourish as a result of the AIF inclusion of VCFs.
The Infrastructure Fund (IF)
The fund makes investments to improve public infrastructure, including as roads, railways, airports, and other means of communication. The infrastructure industry has a high barrier to entry and relatively low competition, making it a good investment opportunity for those who believe in the sector’s future growth.
It is possible to earn both capital gains and dividends from an Infrastructure Fund investment. Government tax incentives could be available to Infrastructure Funds that invest in socially desirable/viable projects.
Angel Fund
Fund managers combine money from a number of “angel” investors and invest in young firms for their development in this form of Venture Capital fund. Investors receive dividends when the new enterprises start making money.
As with Angel Funds, units are distributed to the investors. In the startup world, a “angel investor” is a person who wishes to invest in an angel fund and who also has company management experience to offer. These investors choose to invest in businesses that aren’t often supported by mainstream venture capital funds because of their uncertain growth.
The Social Venture Fund
The rise of the Social Venture Fund (SVF) as a vehicle for investing in companies with a strong social conscience and a desire to effect genuine change in society can be attributed to socially responsible investing.
These companies aim to make money while simultaneously addressing environmental and social challenges. A return on investment is still possible because the companies involved are still expected to make a profit.
The Social Venture Fund prefers to invest in projects in developing nations because of their potential for both growth and social transformation. A win-win situation for all stakeholders is created when the finest techniques, technology and significant expertise are brought to the table by the investors, businesses and society.
In the following blogs, we will cover the investments that come under Category 2 of the Alternate Investment Funds.
Are you aware that one of the most fundamental trading methods is to trade trend pullbacks? Yes! There are numerous strategies to earn from pullback trading.
You may profit from trading pullbacks across all time frames. This is because a trend can occur on any time scale, from the 5-minute to the monthly.
Before we get into commonly used pullback strategies we would like you to know that at Zebu, one of the fastest-growing brokerage firms in the country, we have created the best Indian trading platform with the lowest brokerage for intraday trading.
In today’s blog, we’ll present six profitable pullback trading strategies, but first, let’s define pullback trading:
What does the term “Pullback Trading” mean?
A pullback is a temporary halt or little decline in the price of a stock or commodity that occurs during an ongoing increase.
A pullback is virtually synonymous with retracement or consolidation. The term “pullback” refers to brief price drops – say, a few consecutive sessions – before the uptrend resumes.
Following a significant upward price movement, pullbacks are sometimes considered as buying opportunities.
For instance, following a great earnings report, a stock may have a significant jump before reversing as traders liquidate existing positions. On the other side, positive earnings are a fundamental indicator that the stock will continue to climb.
Most pullbacks see a security’s price move to a technical support level, such as a moving average or pivot point, before resuming its uptrend. Traders should pay special attention to these important support levels, as a breach below them may indicate a reversal rather than a retreat.
Now that we understand what pullback trading is, let us explore several tactics for trading pullbacks:
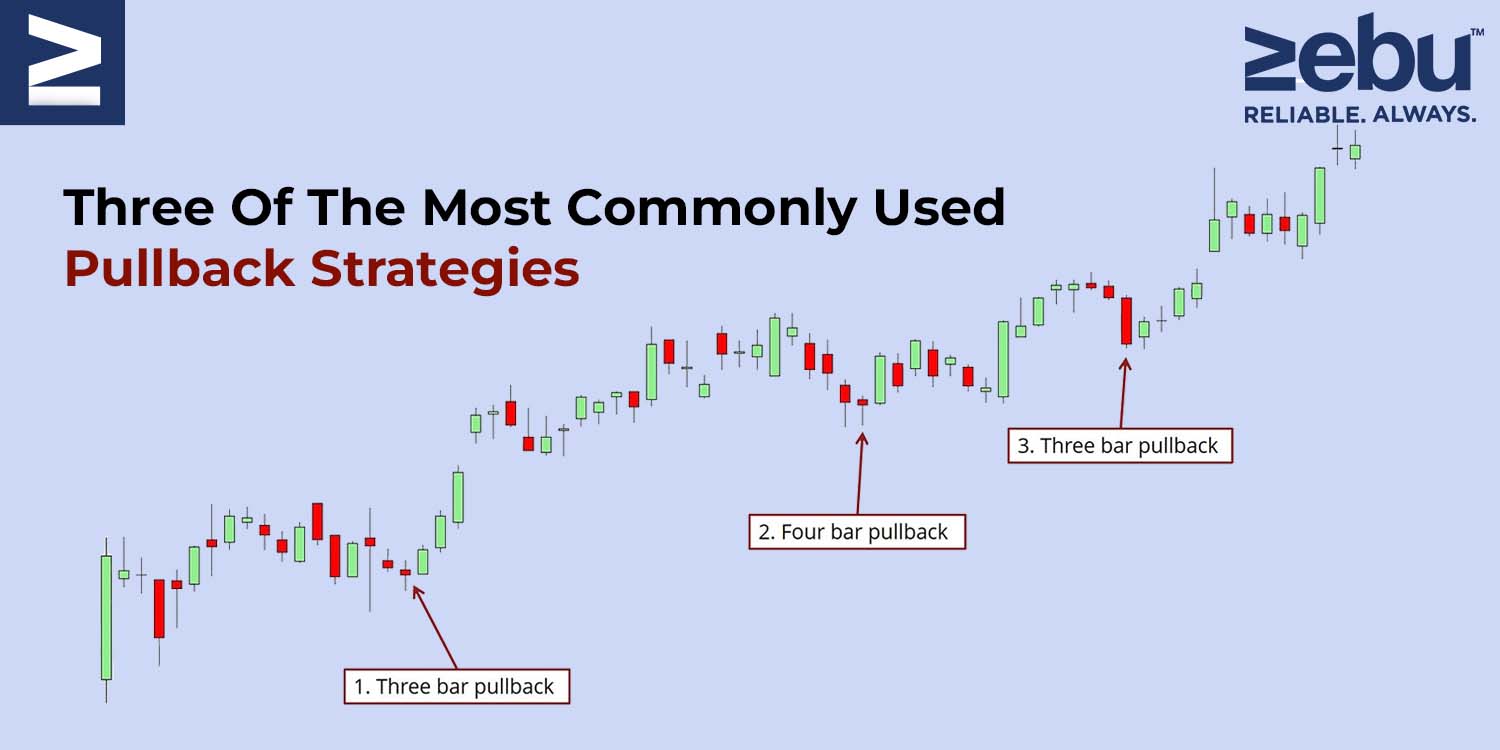
1. Pullback to a trendline Determining the trend’s direction should be quite straightforward. The swing high and low structure is the most straightforward way to recognise a trend.
An uptrend is defined by a series of higher highs followed by a series of higher lows. Whereas a downtrend is defined by a series of lower lows and lower highs.
The disadvantage is that trendlines are frequently validated more slowly. Three contact points are required to validate a trendline. You can always link two random locations, but it is only when you reach the third that you have a true trendline.
As a result, traders can only trade the trendline pullback at the third, fourth, or fifth contact point.
While trendlines perform well in conjunction with other pullback tactics, as a stand-alone strategy, the trader may miss numerous opportunities if trendline validation takes an extended period of time.
2. Pullback to moving average
Without a question, moving averages are one of the most often utilised tools in technical analysis, and they may be used in a variety of ways. Additionally, you can utilise them to trade pullbacks.
A moving average of 20, 50, or even 100 periods could be used. It is irrelevant because it is entirely dependent on whether you are a short-term or long-term trader.
Shorter-term traders utilise shorter moving averages to get hints more quickly. Naturally, shorter moving averages are more prone to noise and false signals.
On the other side, longer-term moving averages move more slowly and are less subject to noise, but may miss short-term trading opportunities. Consider the advantages and downsides for your own trading.
3. Pullback after a breakout
Breakout pullbacks are extremely prevalent, and probably the majority of traders trade this price action pattern.
Pullbacks following breakouts are frequently seen at market turning points, following the price breakout of a consolidation pattern. The most often used consolidation patterns are wedges, triangles, and rectangles.
Open range breakout is another common strategy. Once the day’s 15 minutes low and high are marked, traders enter a long position once the upper limit is broken on a good volume. In this situation, it would be ideal to wait for a pullback to the vwap or the 15-minute high for a better risk:reward potential.
As we mentioned before, trading and investments requires the best Indian trading platform and the lowest brokerage for intraday trading.. As one of the best brokerage firms in the country, we have created a powerful trading platform that makes analysis easy for you. To know more about its features, please get in touch with us now
In the 1930s, Ralph Nelson Elliott established the Elliott Wave Theory. Elliott argued that stock markets, which are widely assumed to function randomly and chaotically, traded in repeating patterns.
In this article, we’ll go over seven crucial things that you should know about Elliot Waves. But before we get into that you need to understand that investment is also about choosing the right technologies. As one of the top brokers in share market, we at Zebu offer trading accounts with lowest brokerage, and an online trading platform to help you focus only on executing your strategies efficiently.
We’ll look at the history of Elliott Wave Theory and how it’s applied to trading in this post.
Waves
Elliott suggested that financial market patterns are determined by investors’ dominating psychology. He discovered that swings in popular psychology usually manifested themselves in predictable fractal patterns, or “waves,” in financial markets.
Market Forecasts Using Wave Patterns
Elliott made precise stock market predictions based on reliable wave pattern qualities he found. An impulse wave always exhibits a five-wave pattern because it travels in the same direction as the broader trend. On the other hand, a corrective wave net travels in the opposite direction of the main trend. On a smaller scale, five waves can be detected within each of the impulsive waves.
Interpretation of the Elliott Wave Theory
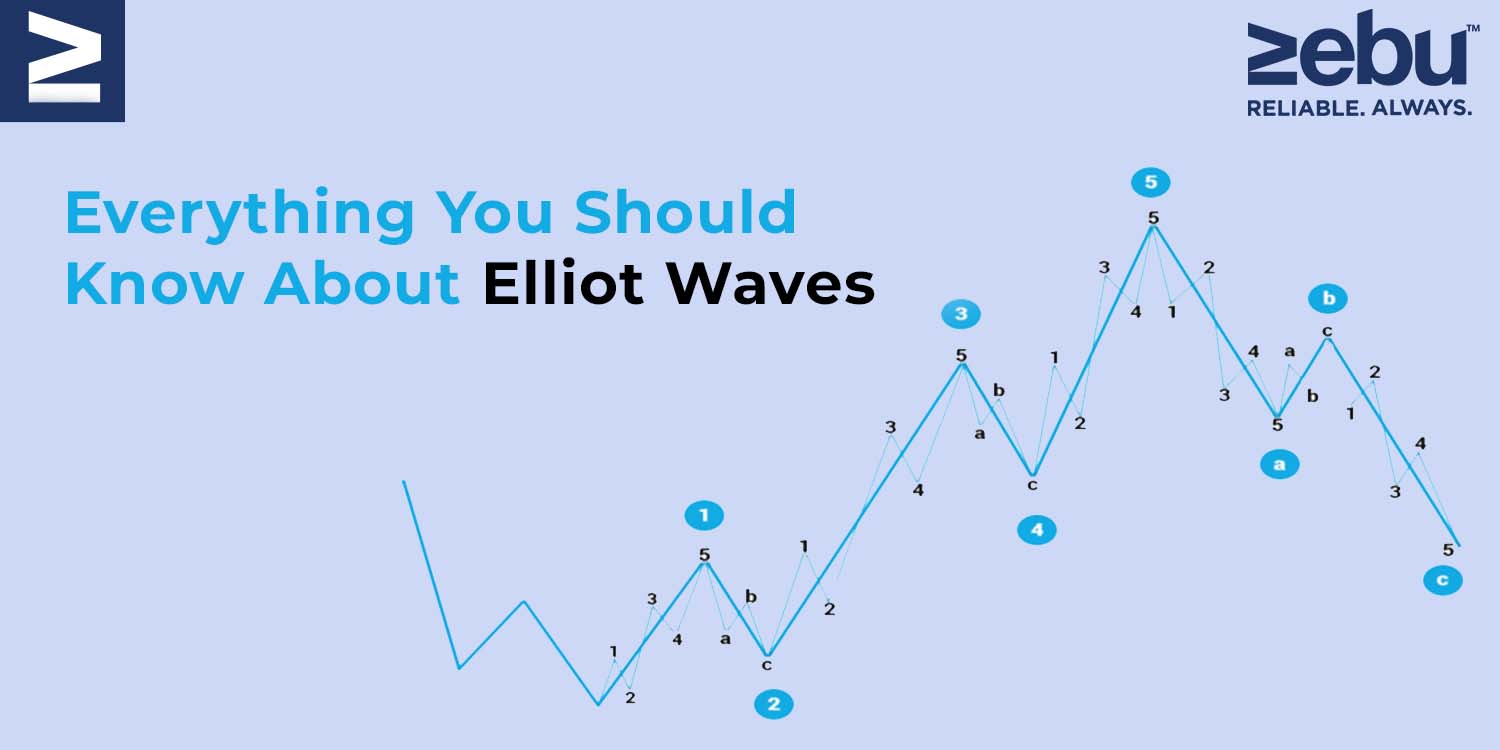
Five waves advance in the direction of the primary trend, followed by three waves in the direction of the corrective (totalling a 5-3 move). This 5-3 move is then subdivided into two subdivisions of the following upper wave move.
While the underlying 5-3 pattern remains consistent, the duration of each wave varies.
Consider the following chart, which contains eight waves (five net upward and three net downward) labelled 1, 2, 3, 4, 5, A, B, and C.
The impulse is formed by waves 1, 2, 3, 4, and 5, whereas the correction is formed by waves A, B, and C. The five-wave impulse, in turn, generates wave 1 at the next-largest degree, while the three-wave correction generates wave 2.
Normally, a corrective wave consists of three independent price movements – two in the direction of the primary correction (A and C) and one in the opposite direction (B). Correction waves 2 and 4 are depicted above. Typically, these waves have the following structure:
Take note that waves A and C in this illustration move in the direction of the trend at a greater degree, indicating that they are impulsive and composed of five waves. By contrast, Wave B is anti-trend and thus corrective, consisting of three waves.
When an impulse wave is followed by a corrective wave, an Elliott wave degree containing trends and countertrends is formed.
As illustrated in the patterns above, five waves do not always go in a net upward direction, and three waves do not always travel in a net downward direction. When the larger-degree trend is downward, for example, the five-wave sequence is downward as well.
To apply the idea in daily trading, a trader may spot an upward-trending impulse wave, take a long position, and then sell or short the position when the pattern reaches five waves indicating a reversal is likely.
The Verdict
Elliott Wave practitioners highlight that just because a market is fractal does not automatically make it predictable. While scientists recognise a tree as a fractal, this does not indicate that the route of each of its branches can be predicted. In terms of practical application, the Elliott Wave Principle, like all other analysis methodologies, has its supporters and critics.
One of the critical flaws is that practitioners can always blame their chart reading rather than flaws in the theory. Alternatively, there is an open-ended understanding of the duration of a wave.
As we mentioned before investment is also about choosing the right technologies. As one of the top brokers in share market, we at Zebu offer trading accounts with lowest brokerage, and an online trading platform to help you focus only on executing your strategies efficiently.