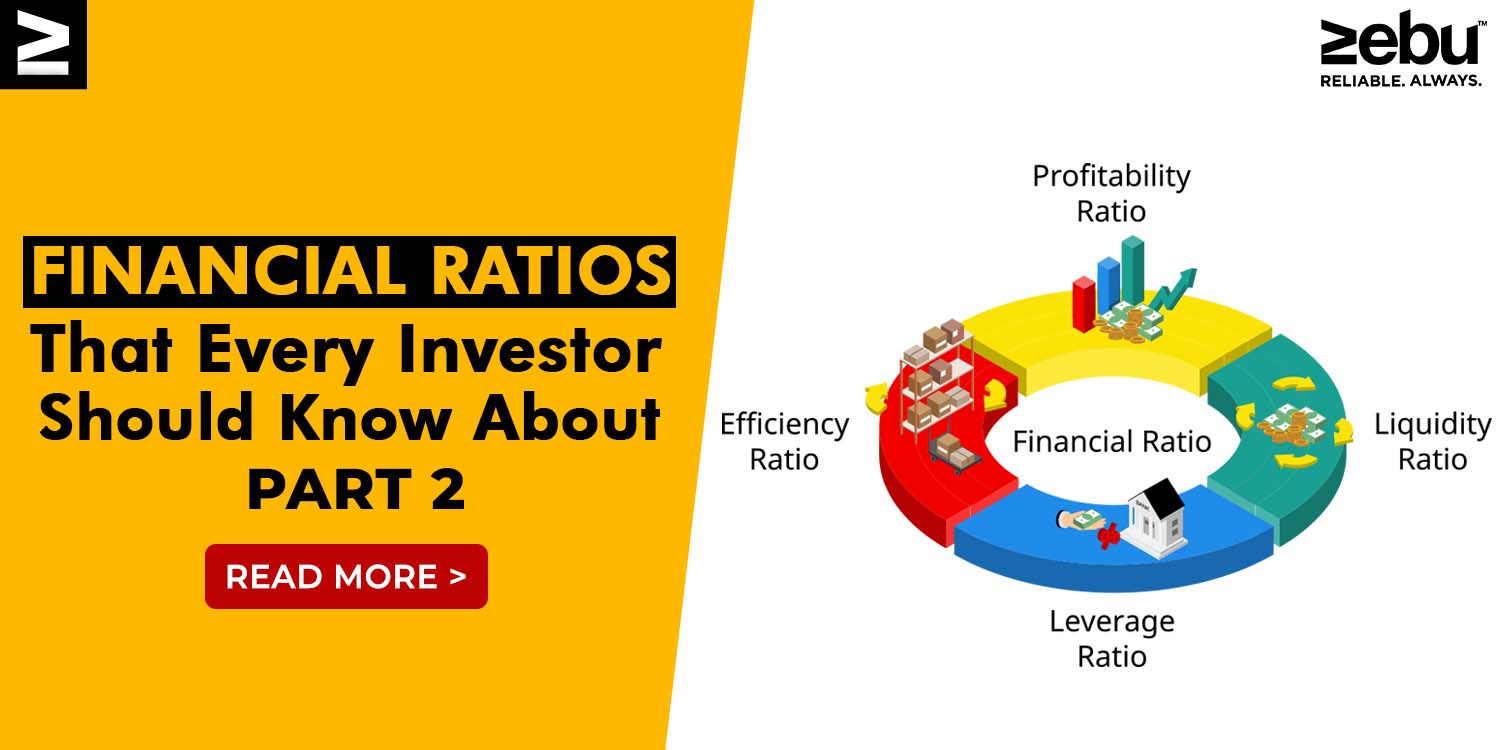
In continuation of our series about important financial ratios that everyone should know about, here are a few more that will help you become a better investor.
EV/EBITDA
People often use the P/E ratio and the enterprise value (EV) by EBITDA to figure out how much a company is worth. Market capitalization plus debt less cash equals EV. It gives a much more accurate takeover valuation because it takes into account debt. This is its main advantage over the price-to-earnings ratio, which can be thrown off by very high earnings that come from debt, as we’ve seen. EBITDA stands for earnings before taking into account interest, taxes, depreciation, and amortisation.
This ratio shows how much a business with a lot of debt is worth. As EV/EBITDA is not affected by the capital structure, it can be used to evaluate businesses with different amounts of debt. A lower ratio shows that a company is undervalued. It is important to note that the ratio is high for industries with fast growth and low for industries with slow growth.
RATIO OF PRICE TO EARNINGS GROWTH
The PEG ratio is used to figure out how the price of a stock, its earnings per share (EPS), and the growth of the company are all linked.
A high P/E ratio is often a sign of a business that is growing quickly. This could mean that something is worth too much. The P/E ratio is divided by the expected growth rate to see if a high P/E ratio makes sense given the expected growth rate in the future. The end result can be compared to that of peers who grew at different rates.
A PEG ratio of 1 means that the price of the stock is fair. If the number is less than 1, it could mean that the stock is undervalued.
RETURN ON EQUITY
The main goal of any investment is to make money. Return on equity, or ROE, is a way to measure how much money shareholders get back from the company’s operations and profits as a whole. Investors can use it to figure out how profitable businesses in the same industry are. Having a number is always better. The ratio shows how good the management is. ROE is the ratio of net income to shareholder equity.
Even though businesses with a lot of growth should have a higher ROE, a ROE of 15-20% is still good. The biggest benefit is when earnings are put back into the business to make a higher ROE, which leads to a faster growth rate. But it’s important to keep in mind that a rise in debt will also lead to a rise in ROE.
INTEREST COVERAGE RATE
It is found by dividing interest costs by EBIT, which stands for earnings before interest and taxes. It tells how healthy a company’s finances are and how many interest payments it can make through its activities alone.
When comparing businesses in different industries with very different depreciation and amortisation costs, EBITDA can be used instead of EBIT. Or, if you want a more accurate picture of a company’s ability to pay its bills, you could look at its earnings before interest but after taxes.
CURRENT RATIO
This shows the liquidity situation of the company, or how ready it is to pay its short-term debts with its short-term assets. If the number is higher, it means that working capital problems won’t affect how the company runs. Red flags go up when the current ratio is less than one.
The ratio can be found by dividing the current liabilities by the current assets. Receivables and stock are examples of what are called “current assets.” Businesses can find it hard to turn receivables into cash and inventory into sales. This could make it harder for it to meet its obligations. In this case, the investor may look at the acid-test ratio, which is similar to the current ratio but doesn’t include inventory and receivables.
ASSET TURNOVER RATIO
It shows how well the management makes use of resources to make money. The better the ratio, the more money the business makes for every rupee it spends on an asset. The ratio is better if it is higher. Experts say that the comparison should be made between businesses that work in the same industry. This is because the ratio could be different in different industries. Asset-heavy industries like telecommunications and power have a low asset turnover ratio, while retail has a high one (as the asset base is small).
DIVIDEND YIELD
Dividends per share are based on how much each share is worth. If the number is high, that means the business is doing well. But penny stocks, which are low-quality but have high dividend yields, and businesses that sometimes make a profit or have extra cash they can use to pay special dividends should be avoided. In a similar way, a low dividend yield may not always mean that an investment is a bad one. For example, businesses (especially those just starting out or growing) may decide to reinvest all of their profits in order to give their shareholders good long-term returns.
Financial ratio research helps evaluate things like profitability, effectiveness, and risk. Before investing in a stock, you should also look into the macroeconomic environment, the quality of the management, and the outlook for the industry.
