Tag: market trends

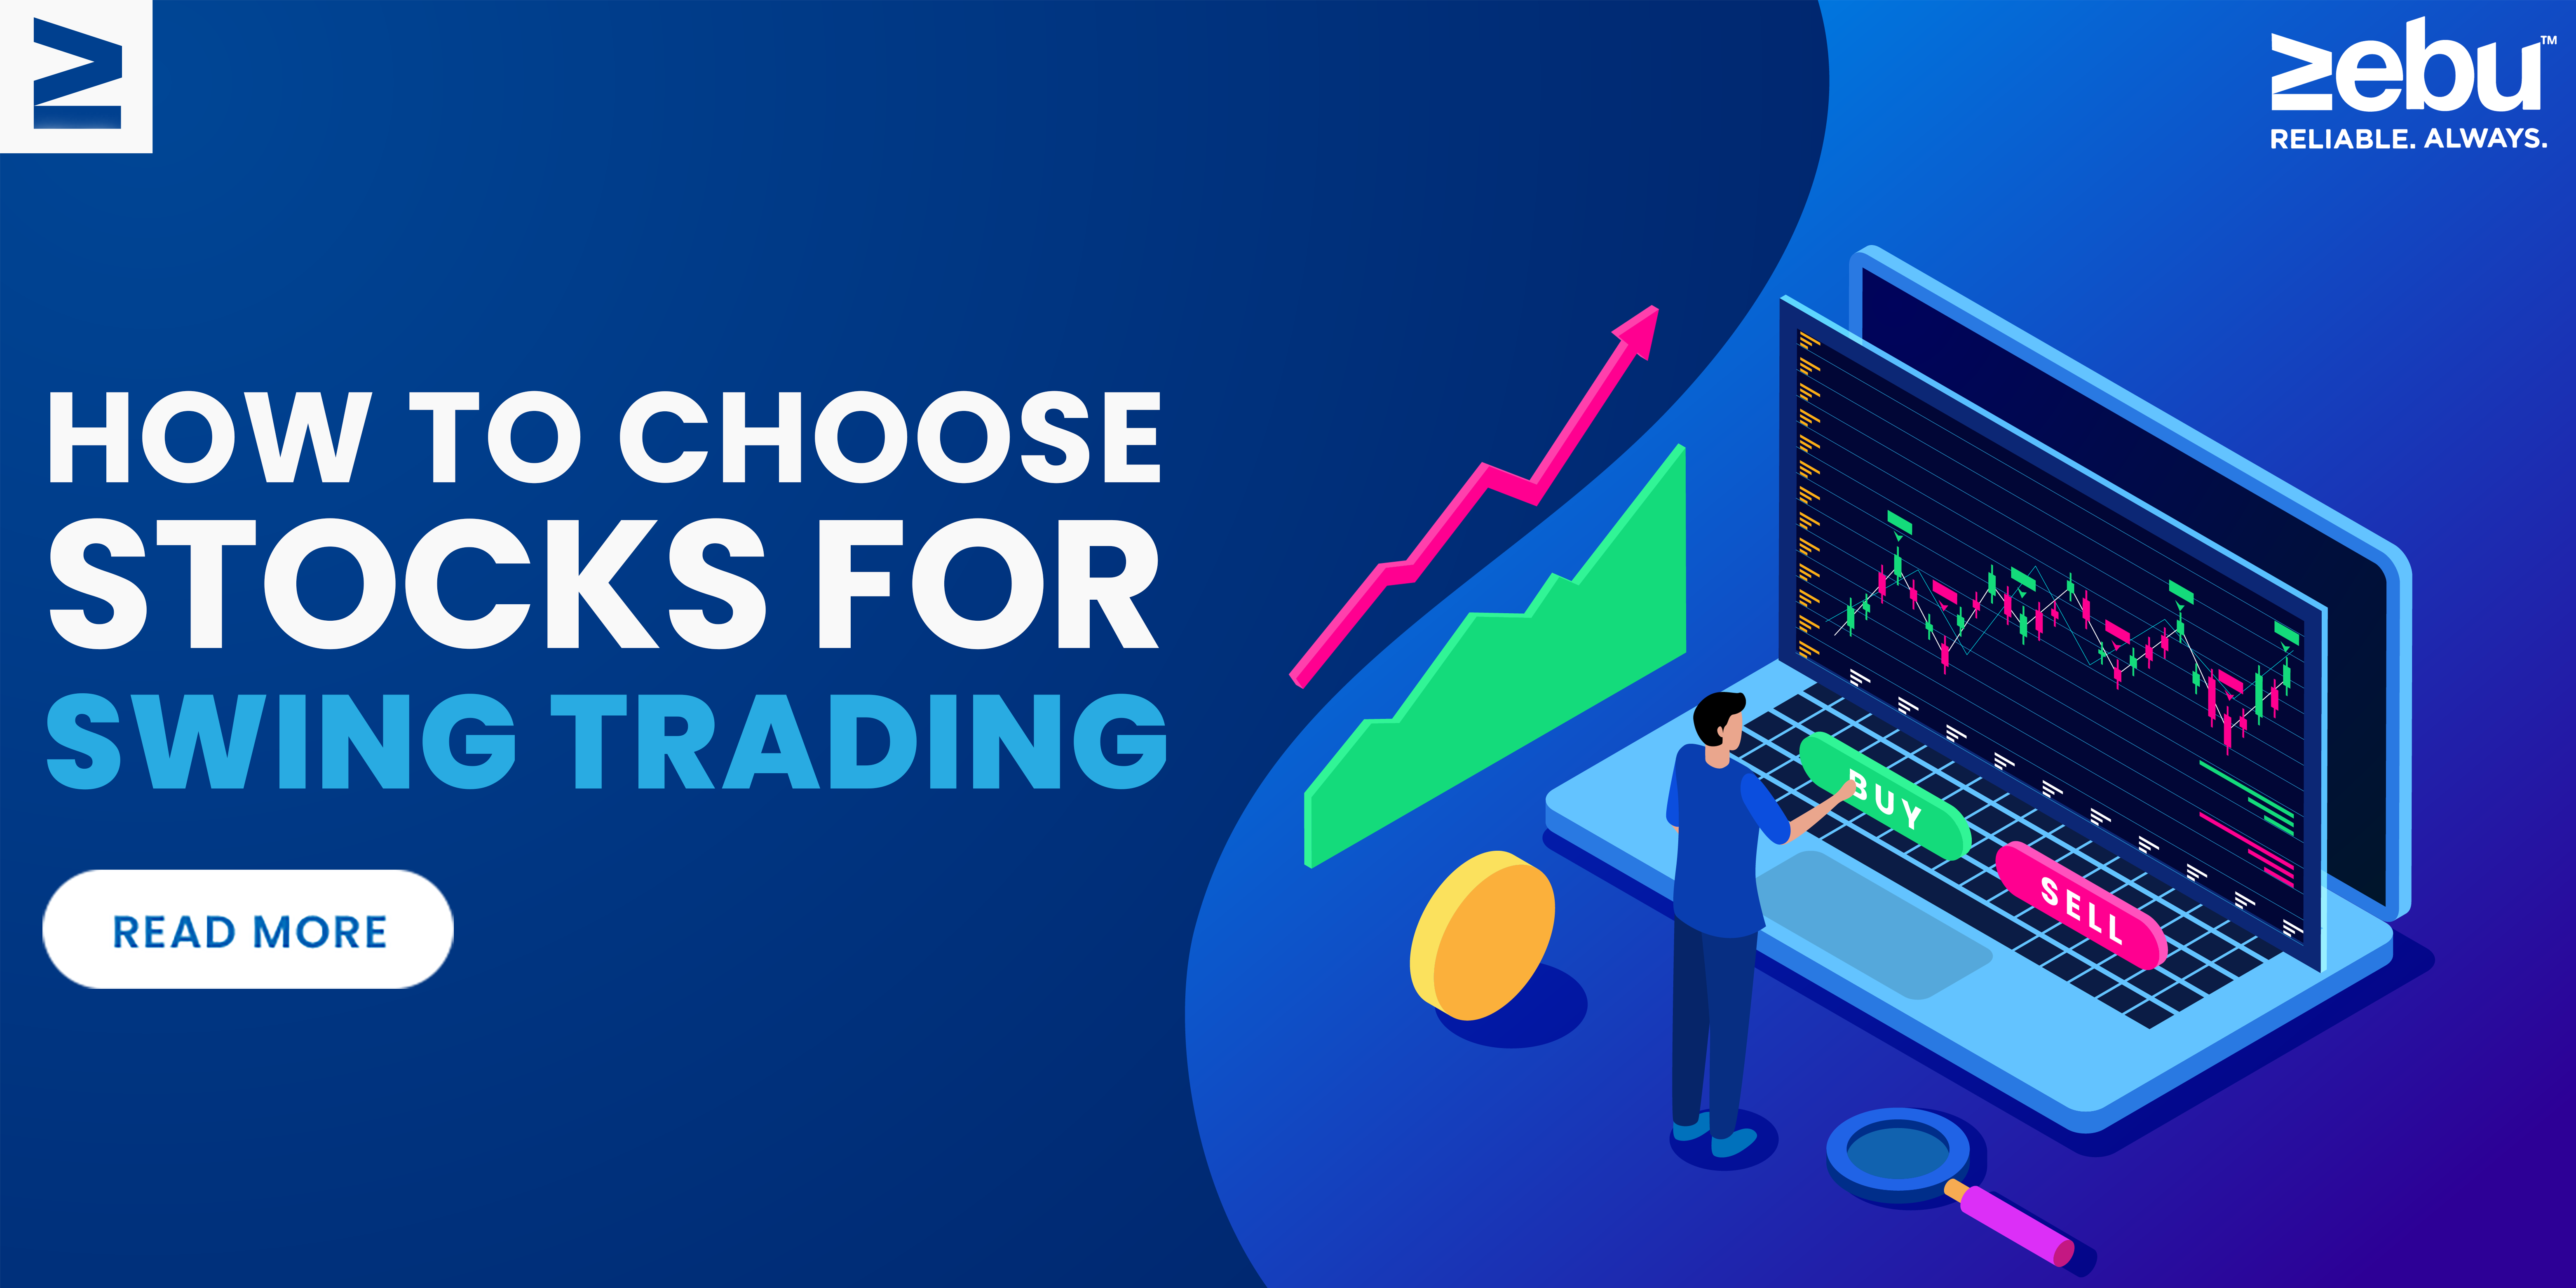
  • How To Choose Stocks For Swing Trading

    You might know what swing trading is, but might not know where to begin. A good swing trading strategy starts with learning how to find stocks for swing trading. Swing traders carefully choose stocks that have a good chance of doing well in the future. This lets them take a much larger share of the market. How do they do that, though? Let’s look into swing trading’s mysteries.

    With swing trading, you can make money from market changes that happen over a few days or weeks. Like day trading, it gives traders the chance to make money when the market moves in their favour. Your strategy for trading will be built on your ability to pick the right stocks. Like day trading, you would also have to choose stocks with high liquidity and the chance of big changes in price and volume. So, let’s talk about how to find stocks that are good for swing trading.

    How to Pick Stocks for Swing Trading: The Simple Rules
    Swing traders will always swear by a few general rules. Of course, you can make your own plan and put it into action, but having one or two of these is a great place to start.

    Market direction

    When trading, traders follow a rule that says if a stock’s value is going up in the current market, it will keep going up if the market stays the same.

    You can find the best-performing stocks in a number of ways, such as by reading company news, looking for the best stocks on the market, or keeping an eye on stock indices.

    Orientation bias

    Swing traders look for possible buy or sell signals to find opportunities. They use a mix of basic information and technical analysis to find industries and stocks that do better than indices for a large part of the trading day. They sort through the stocks to find ones that have the right amount of volatility and volume to store their expectations. This process, called “screening stocks,” is made up of the following steps.

    Liquidity is a very important metric for swing traders. The number of times a stock trades each day shows how popular it is on the market. How often a stock trades on the exchange tells you how liquid it is. If a stock trades a lot every day, it is considered liquid enough for swing trading. Stocks with a lot of trading show less risk.

    Performance is a way to compare how well a stock has done compared to other stocks in the same industry. The goal is to find the best stocks in each sector that have done better than sector indices.

    Swing traders look for stocks that trade in the same way over and over again. They think that a pattern that keeps coming up is more reliable. Experienced traders will wait for the stock to break out of its trading range before they decide when to buy or sell. They might make a few small profits while they wait by trading in the direction of the trend.

    Some swing traders may like stocks that are less volatile and have a clear uptrend. They stay away from stocks that are prone to big drops and selling for no reason. Instead, they would keep holding on to stocks whose prices didn’t change much and had no gaps in the price line.

    Correlation and volatility: Stocks that go against the market trend may look good, but most swing traders will stay away from them. It makes sense to stay away from stocks that aren’t stable and instead focus on those that track key market indices. Look at how a stock has been acting in the past to figure out why it is acting the way it is.

    Another important factor is how volatile the market is. Volatility is a way to figure out how much a stock price will change, if the target and stops are reasonable, or if the risk criteria are good enough for the amount of time the trader wants to keep the position open.

    Conclusion

    After we’ve talked about how to swing trade stocks, it’s important to know that swing trading is riskier than day trading because it involves keeping stocks for a longer time. You need a strong strategy to help you find trade opportunities and possible red flags.

    When picking stocks for swing trading, investors should keep in mind that there are other ways to do things besides the ones described in this article. Every trader needs to come up with a plan that works for them.

    Whether you swing trade or not, it will help you a lot in the stock market to know how to find stocks to swing trade. You can use this information to make trading plans that will make you money and to learn more about how stock prices move.

  • How To Trade With Support And Resistance


    Title Page Separator Site title

    Technical analysts use a number of rules to predict how much stocks will go up or down in the future. Once you know what a trend is, the next important idea in technical analysis is support and resistance.

    The theory of support and resistance

    According to technical analysis, when the price of a stock reaches certain predetermined price points, it tends to stop and move in the opposite direction.

    Support level: This is the point where the price of a stock stops going down. It’s possible that the price will go up instead of down. At this point, it is likely that the demand from buyers will be much higher than the demand from sellers.

    Resistance level: The opposite of a level of support is a level of resistance. It is a price level (ceiling) above which the stock price is not expected to rise. At this price, the market for this stock is better for sellers than it is for buyers.

    What does support mean?

    The support and resistance levels on a candlestick chart might help you figure out the target price at which to buy or sell. The support level is where the market expects more buyers than sellers. The price at which traders can expect to see the most buying interest in a stock is called the support level on the chart.

    In a falling market, the support-resistance indicator, which is an important level market player to watch for, is often a sign to buy. The support line is formed when the price of a security goes down and the demand for shares goes up.

    What is resistance?

    On a candlestick chart, a price has reached the resistance level when there are more sellers than buyers. Resistance level is a price point on the chart where traders expect to sell as much of a certain stock as they can. It keeps the price from going up even more.

    Since resistance is always higher than the current market price, it is often a sign to sell. In a bullish market, the resistance level is one of the most important things that traders pay close attention to. Support and resistance are, in a nutshell, the exact opposites of each other.

    By looking at the support and resistance levels, the trader can get an idea of how the price of a stock will move. But there is always a chance that the stock price will go above these levels. When this happens, which happens often, a new level of support and resistance is set up.

    If the support level is broken, the stock price will keep falling until it finds a new level to support it. Also, if the stock price breaks through the resistance level, it keeps going up until it hits a new resistance level.

    Resistance and Support: How Reliable Are They?

    Even though support and resistance can tell you when to buy or sell, you shouldn’t rely on them alone. Or, to put it another way, before deciding whether or not to buy or sell a certain stock, you should think about a number of other things.

    When it comes to technical analysis,
    Predicting the future price of a stock is the most important (and hard) part of analysis for a trader in the stock market. The next high (or low) price cannot be predicted with any level of reliability.

    So, the idea of support and resistance is a good way to understand how prices change. Support and resistance levels help traders make decisions because they let them see patterns.

    For example, if a trader sees that a stock has reached a support level, he could buy more shares. This is done so that the stock has a better chance of coming back. In a similar way, the trader may sell his shares and make money when the stock reaches a level of resistance.

    When a stock’s price reaches these levels, you should always be careful because the area between the support and resistance levels is known to be very volatile.

    Conclusion

    Traders can use the idea of support and resistance to spot trends in the stock market and take advantage of them.

    This doesn’t mean, though, that the stock will never go above a support or resistance level. The price of a stock can always go up or down. Also, as a trader, you shouldn’t make trades based only on these levels.

  • Trendline Trading Strategies For Beginners

    Individual traders tend to utilise technical analysis more frequently than fundamental analysis, so trendlines are particularly popular in both forex and cryptocurrency trading. Interest rate movements affect forex markets, yet central banks’ established interest rates seldom fluctuate. This implies that prices fluctuate in line with traders’ predictions of interest rates, which are far more difficult to interpret. Price action and analytical tools like trendlines, according to technical experts, are the most reliable ways to gauge the sentiment of traders.

    Trading strategies using trendlines

    There are other methods to employ trendlines, but in this article, we’ll go through the two most popular trendline trading techniques as well as a third, less well-known but extremely viable, strategy.

    1) Trendline reversal

    Trading in accordance with the trendline-supported trend is the aim of this technique. Either purchasing or selling near to an uptrend or downtrend line.

    Steps in the plan:

    Decide if the price is moving up, down, or sideways.
    Create a trendline that connects at least three swing points.
    the trendline be extended into the future
    A) Watch for a subsequent price contact of the trendline B) Place a limit order at the trendline (adjust as price moves)
    When the price has reached the trendline, place a trade in the trend’s direction.
    In an upswing, place a stop-loss order under the prior swing low (above the previous swing high in a downtrend)
    Place a take profit order with a minimum ratio of 2:1 to the stop loss size.
    Example of a chart: trendline bounce

    2) Trendline break-through

    Although the trendline breakout may be utilised to trade against the trend, that is not what we are promoting here. How is breaking a trendline a trend-following tactic? Trading the breakout of short-term trendlines in the direction of the main trend is how it’s done!

    Steps in the strategy: identify a long-term trend
    Wait for a price “correction” or buck the general trend.
    Create a trendline to represent this recent correction.
    Keep an eye out for the price to go over this trendline.
    A) Place a stop order past the trendline to enter on the breakout B) Buy at the break of a downtrend line or sell at the break of an uptrend line
    On the other side of the trendline, place your stop loss order.
    Place a take profit order with a minimum ratio of 2:1 to the stop loss size.

    Examples of charts: inner trendline breakout

    3) Confluence between trendlines

    The use of trendlines is effective, however no technical indicator or price action trading strategy is faultless. Using many analysis techniques and watching for possibilities when they all come to the same conclusion will always boost your chances of success on a transaction.

    For instance:

    Using Fibonacci retracements, draw trendlines
    In this illustration, a buying opportunity at a rising trendline is supported by one at the 61.8% Fibonacci retracement level.

    Moving averages and trendlines
    In this instance, a rising trendline coincides with the prominent 200-day moving average.

    Japanese candlestick designs with trendlines
    In this case, bullish engulfing candle patterns help trendline bounces.

  • How To Trade With The Trendline

    Trendlines are one of the most simple and useful tools that traders use. Read on to find out what they are, how to draw them, and the best ways to trade based on trendlines.

    What is a trendline?

    A trendline is a line that is drawn through a chart to show the trend. On price charts, trendlines are drawn to show the general direction of prices in the trading environment. Traders use this information to decide whether to buy or sell in the direction of the trend. Trendlines can be used to track the price of a stock, a currency pair, or a cryptocurrency. In technical analysis, trend lines are one of the most common ways to show how prices are moving.

    A good example of how a trendline works

    Usually, a trendline is made by drawing a straight line between a number of swing highs or swing lows. For an up-trend line and a down-trend line, the swing lows and swing highs are used. In this method, the trendline helps traders understand till when a trend can continue. These can also be thought of as dynamic support and resistance points.


    Starting on the left side of the chart and moving the line to the right is how you draw a trendline. As a general rule, a trend line must go through at least three price “swings” before it can be taken seriously.

    How to use trend lines in trading

    Use a trend line to figure out the direction of the price trend. Traders can then choose to go with the trend if they think it will keep going or against the trend if they think it will change. Both strategies use the same way to read the trendline.

    Bullish because the price is above the uptrend line, which means the trend is going up.
    Bearish because the price is below a line that shows the price is going down.

    Trend following

    Trend following is a way to trade where you buy when the price is going up and sell short when the price is going down. A common trading strategy is to use an uptrend line to figure out if the general price trend is going up. A decline can also be shown by a line going down.

    Trading against trend

    Countertrend trading is a way to trade where you sell when the price goes up and buy when the price goes down. This is more like the basic rule of investing, “Buy low and sell high.” Reversion to the mean says that after a price trend goes in one direction, it will eventually go back to its average price. This is why short-term traders trade against the trend.

    The following point is one of the most important pointers to remember while using a trendline.

    Using a trendline when there is no trend is the worst mistake you can make as a beginner with trendlines. The clue is in the name!

    The best angle for a trend line is 45 degrees. Even if the trend keeps going in the same direction, a slope of more than 45 degrees means that the price is going up too quickly and could easily break the trendline. Less than 45 degrees means that the trend is weaker and is almost trading sideways.

    Three times in total

    As a trendline goes through more swing points, more traders can see it. This makes the trendline stronger. But after five touches, the chances of the trendline “breaking” are much higher.

    Zoom out

    To see where the trend you’re trying to show with the trendline started, make sure to zoom out on your trading platform’s chart. For example, if you want to draw an uptrend, try to start your trendline at the bottom of the previous downtrend or at the swing low.

    Five trendlines zones

    Trendlines are not based on good science. Price doesn’t often hit a trendline right before it turns around. The trendlines shouldn’t be taken as a specific price but as an “area” of prices. Having this information makes it easier to choose an entry price and a stop loss.

  • Everything You Need To Know About Thematic Mutual Funds – Part 2

    A thematic fund’s portfolio is made up of stocks from companies in different industries that have something to do with the theme of the fund. Some investors might not know how each of these industries is growing. You can decide if certain sectors can help you make a lot of money if you know enough about them and how they relate to the subject of the fund. So, thematic funds are a good choice for investors who like to keep up with the news and are good at researching a wide range of industries. Investors can decide if they want to put their money into a certain topic by keeping an eye on a lot of places and getting useful information.

    4. Things to think about before putting money into theme-based funds

    Investment Goals: Before buying these funds, you should be sure of what you want to do with them. If you want the best return on your theme fund investment, you should invest for more than five years. It’s not hard to see why. Any business needs enough time to reach its full potential. So, when you put money into these funds, you should have long-term goals in mind, like retiring early, paying for your child’s college, etc.

    Investment Risks: The benefits of investing in theme funds may seem appealing, but it’s important to know the risks that come with it. It is a very dangerous way to go. Because of this, people who have never invested before are told not to buy themed funds. Let’s look at the main risks that come with these funds:

    Semi-Diverse Portfolio: Compared to sectoral funds, which don’t offer any variety, a theme fund’s portfolio is a bit more diverse. It does, however, offer fewer ways to spread out your investments than other equity funds, like multi-cap funds, whose portfolios include securities from many different industries. Since these equity funds don’t have a theme, it’s less likely that all the stocks will fall at the same time than it is with thematic funds.

    Some themes could take longer to develop than expected. Even if some of us can see that a theme has a lot of potential in the near future, say in the next four or five years, our predictions are likely to be wrong. It might take longer than we thought. There were a lot of brand-new funds with themes, and many investors hoped to make money from them. Even though infrastructure has been a topic for more than ten years, there hasn’t been much progress. When investing in themed funds, an investor may have to wait up to 20 years to see a profit. There is a risk of time with theme funds.

    Expense Ratio:

    You need to be honest about the costs that cut into your profits. For managing the thematic funds you want to invest in, Asset Management Companies (AMC) will charge you a fee called an expense ratio. This fee is mostly used to pay for the fund’s overhead costs, such as the salary of the fund manager and marketing costs. The fee is charged once a year.

    5. Taxation of Thematic Funds

    What matters are the profits after taxes. You should know how taxes work with that kind of money. The capital gains you made when you sold your theme fund are taxed based on how long you held on to it.

    If you sell your investments within a year, the profits are considered short-term capital gains (STCG), and you have to pay 15% tax on them.

    Long-Term Capital Gain Tax (LTCG):

    Gains from any investment held for more than a year are considered Long-Term Capital Gains and are taxed (LTCG). Gains of up to Rs. 1 lakh are not taxed in a fiscal year. Gains of more than Rs. 1 lakh are taxed at 10%.

    These are the important things to know about Thematic mutual funds. To start investing in them, open your demat account with Zebu today.

  • Everything You Need To Know About Thematic Mutual Funds – Part 1

    Each mutual fund is based on an asset that brings in money. Large-cap funds’ underlying assets are the stocks of some of India’s biggest companies based on market capitalization. In a similar way, thematic funds are made up of stocks of companies that all have something in common with a certain theme.

    For example, a fund with an ESG theme will invest in companies from different industries that have done well in terms of the environment, society, and the way the company is run (from technology to financial services to FMCG to Consumer Durables).

    Because of this, thematic funds are different from traditional investment strategies like market capitalization (large-cap, mid-cap, small-cap), style (value & growth), and sectoral investing (pharma, technology, infrastructure). As long as it has something to do with the topic, it invests in many different industries and market values. SEBI also says that 80% of a company’s total assets must be invested in stocks and securities related to stocks of a certain theme.

    1. What are the pros of investing in thematic funds?
    More options for diversification than sectoral funds.
    When you invest in a sector fund, your portfolio is limited to that sector, so you don’t have any other options for diversification. Your portfolio will suffer if the sector is doing badly for any reason. Thematic funds, on the other hand, invest based on a theme and may include stocks from companies in different industries. This gives you a bit of diversity. For example, think about a fund whose main focus is on manufacturing. This fund puts its money into a wide range of engineering, chemical, and construction businesses. So, even if businesses in one area aren’t doing well at a certain time, businesses in other areas will keep your portfolio from falling apart in a big way.

    2.Returns that beat the market

    If the investor chooses the right theme to invest in, thematic funds may produce amazing returns. Still, we need to realise that getting the theme right is harder than it seems. It requires that you keep an eye on the things you’re interested in and pay attention to the news and headlines all the time. If, after all your hard work, you really nail the topic, thematic funds could pay off in a big way for you.

    3. Who is a good fit for thematic funds?

    Investors with a high risk tolerance:
    Thematic funds are one of the high-riskmutual funds. When a portfolio is put together with a theme in mind, it limits the kinds of investments that can be made. It would only be able to put money into companies with shares in that area. So your portfolio has a little bit of everything. If for some reason this theme doesn’t come true, there is a big chance of losses. So, these ETFs should only be bought by investors who can handle high risk.

    Investors Who Want Long-Term Returns: It might take a while for a subject to reach its full potential. For example, we’ve known since the early 1990s that software and internet technologies had a lot of potential. But now, 20 years later, we can really see how these ideas work in the real world. So, it takes time and hard work to turn these topics into profitable investments. If you’re an investor who wants to make money over the long term, thematic funds may be a good choice for you. People who are just starting out with investing are told not to put all of their money into themed funds right away.

  • 10 Things You Should Consider Before Investing In An IPO

    Investing in an IPO can be a great way to build wealth with promising companies. However, if last year is anything to go by, IPOs can be extremely tricky to invest in. If you are purely investing in an IPO to benefit from the listing gains, we suggest that you find promising companies, apply to the IPO and sell your shares on the day that it gets listed. However, if you are a long term investor, you can hold on to your gains.

    In this blog, we’ll talk about what an IPO is and the 10 Things to Check Before Investing in them.

    1. Read the Red Herring Prospectus. A company files the Draft Red Herring Prospectus with SEBI when it wants to sell its shares to the public to raise money. This document explains how the company plans to use the money it gets from the public and what risks investors might face. So, people who want to invest in an IPO must read this document first.

    2. Reasons for Raising Money: It’s important to know what the company plans to do with the money it gets from the Initial Public Offering. One should find out if the company wants to pay off its debts or if it wants to raise money to grow the business, or use the money for other business purposes. This shows that the money will be used well in the business, which is a good sign for an investor.

    3. Know the business model: Before investing in the Initial Public Offering, investors should know what kind of business model the company has. Once they know what kind of business the company is in, the next step is to find a new market opportunity. This is because the size of the opportunity and the company’s ability to get a share of the market can make a big difference in the company’s growth and shareholder returns. If investors don’t understand what the company does for business, they shouldn’t buy into its IPO.

    4. Analyzing the background of the company’s management and promoters: It’s important to find out who runs the business since they are the company’s backbone. Investors should look at both the people who started the company and the people who run it since both play important roles in how the company works. The company’s management is a big part of what moves the business forward. One should look at the qualifications and length of time that the company’s top management has been there. This gives an idea of how the company works.

    5. The company’s strengths and weaknesses: Before putting money into a company’s IPO, you should do a SWOT analysis of the company. The DRHP can be used to figure out what the company’s biggest strengths and weaknesses are. Investors should find out where the company stands in the industry it is in. People who want to invest in a business should try to learn as much as they can about the company and the strategies it uses.

    6. The company’s valuation: Investors should also check the company’s valuation, since the offer price could be too low or too high depending on the industries it works in and its financial ratios.

    7. The company’s health: It’s important to look at how well the company has done financially over the past few years to see if the company’s sales or profits have been growing steadily. If the company’s sales are going up, it might be a good idea to invest in its Initial Public Offering. Before putting money into an IPO, investors need to know how healthy the company’s finances are.

    8. Investment Horizon: An investor should know what their investment horizon is before putting money into an IPO. They should decide if they want to buy shares in the IPO just to trade them on the day it is listed or if they want to keep them for a longer time. The reason for this is that a trading strategy would depend on how the market is doing right now, while a long-term strategy would depend on how the company is doing in its core areas.

    9. Comparable Peers: Investors should also look at who the company’s competitors are. The DRHP compares the company to its peers in terms of both its finances and its value. Investors can look at how the company is valued compared to its peers to see if it is priced fairly.

    10. The company’s potential in the market: Investors should also look at the company’s opportunities and threats in the sectors where it operates. This is important for long-term investors to determine if the investment is worth it.

  • Things To Keep In Mind During A Market Correction

    Some investors are wary of the stock market and investing in stocks in general because these markets tend to be unstable. Investors say they’d rather be safe than sorry, so they put their hard-earned money into relatively safe investments like government-issued bonds and fixed deposits. People who say the stock market is extremely volatile aren’t completely wrong, because it can be. But it’s important to remember that investors and traders who know what they’re doing can get a good idea of how volatile the market is and limit any possible loss.

    While you analyse how the market is going to act, it is important you have the best tools in hand. At Zebu, we aim to offer our users the best trading accounts and the lowest brokerage for intraday trading to make their online stock trading journey easy.

    Correction in the stock market

    If you are a big investor and most of your money is in stocks or if you want to start trading and investing in the stock market, you need to know about stock market corrections. A “correction” in the stock market is when prices fall by at least 10% from their previous highs. Just the fact that prices are falling gives it a bad reputation. Even though this might make you feel nervous, it doesn’t always mean something bad. Most investors think that this is a normal part of trading on the stock market. In light of this, there are a few things you should know about corrections in the stock market.

    1. Types of corrections

    The markets can only go up or down. But when the market goes down, it can go down in different ways. For example, a “pullback” is a change of about 5% in market prices. A correction, on the other hand, is a little bit bigger, with a drop of 10–20% from previous highs. Then you have what is called a “bear market,” which means that prices have dropped more than 20% from their previous highs. This could go on for a longer time than a pullback or a correction. When you buy shares online, the good news is that bear markets don’t last as long as bull markets.

    2. Inevitable Corrections

    Corrections are the only way to reach a balance that makes sense for markets to stay in a healthy state. If markets go through the roof, it means that other parts of a country’s finances, like inflation, are in trouble. Because of corrections, investors can buy stocks at fair prices.

    3. Greater uncertainty

    During a correction, volatility, as measured by the VIX (volatility index), is thought to reach greater heights. This is because investors’ feelings change all the time, and a wide range of feelings affects market prices.

    4. Expectations

    Corrections in the stock market can’t be predicted, but they happen as often as the sun rises and sets. Also, a crash in the stock market doesn’t have a clear cause. Some stock market investors make predictions based on what happened in the past, but this isn’t a sure thing.

    5. A chance to make a long-term investment

    Long-term investors like it when the stock market drops because they can buy stocks at lower prices (called “discounts”) and they don’t mind keeping them for a long time. When the stock market as a whole falls, the prices of individual shares tend to fall as well. This is great for people who invest for the long term.

    6. Temporary

    Corrections are temporary. Most people agree that they may only last a little more than a year at the most. This is important to investors because months of hard work can go to waste in a single day, but if you look at the big picture, the highs of the stock market are higher than the lows of corrections.

    7. Dividends

    When you buy shares online, you should know that in the past, growth stocks have helped the stock market as a whole reach new heights. But stocks that pay out income or dividends can be a safer investment. These come from stable companies and give you dividends you can count on. They start making money after a few years. If you buy “dividend stocks,” you might still get returns that won’t change if the market goes down.

    No Reason to Worry

    A few changes here and there don’t matter much in the long run. In general, the market is always going up.

    Stock Market Trading and Investment
    You shouldn’t worry about a correction when you open a Demat account. Many investors do this, and it keeps them from having a healthy view of investing and diversifying their portfolios. You can learn and make money at Zebu, and we can help you make smart investments.

    At Zebu, we aim to offer our users the best trading accounts and the lowest brokerage for intraday trading to make their online stock trading journey easy. Check our website for more info

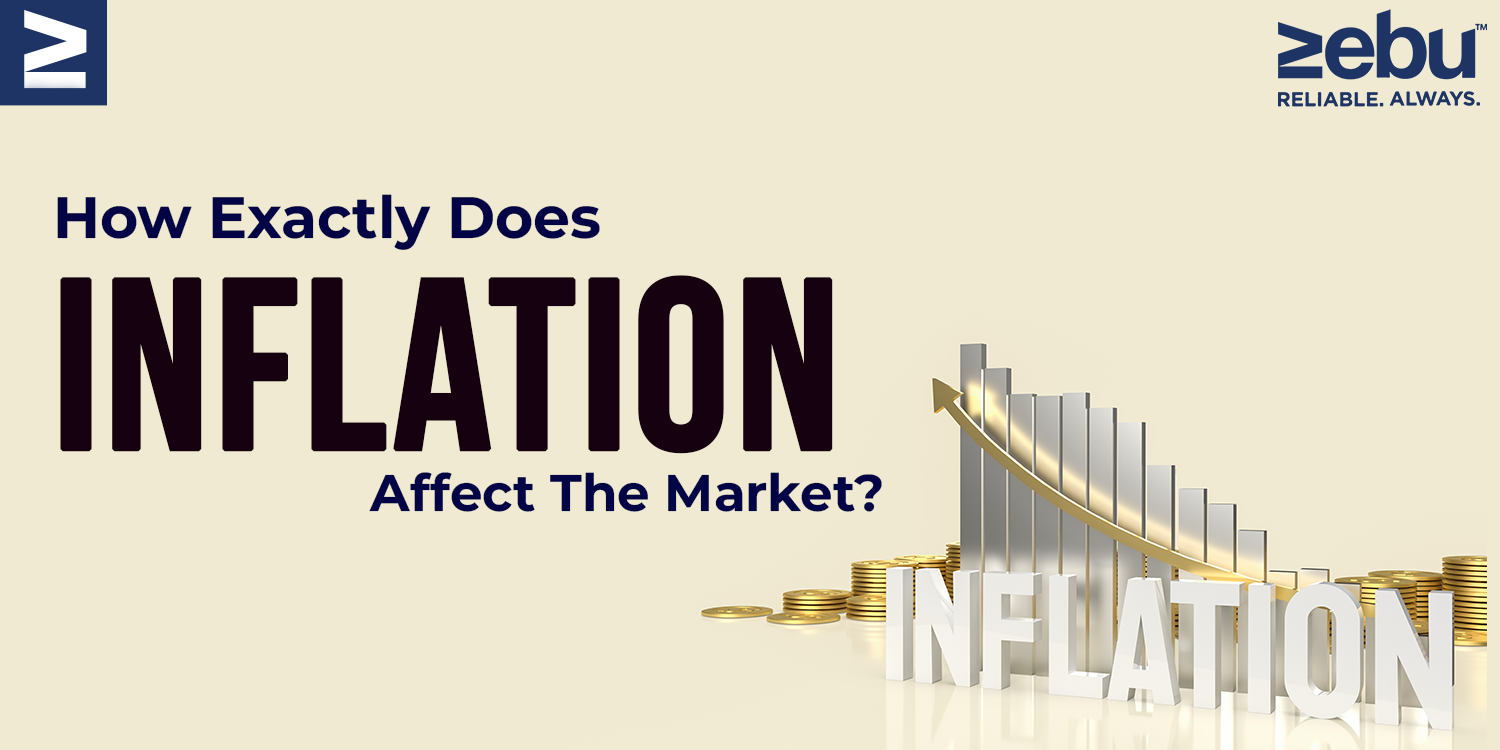
  • How Exactly Does Inflation Affect The Market?

    Most of the time, we think of inflation as a bad thing for stock markets. It’s not hard to figure out why. When inflation is high, the cost of living goes up and people have less money to spend. When inflation goes up, people earn less in real terms, and when inflation is taken into account, this means that their returns are lower. Second, when inflation goes up, interest rates go up, which also raises the cost of equity. There are also times when the effect of inflation on the stock market is seen as a good thing. So, what does inflation mean for the Indian stock market? Does inflation have anything to do with investments? When inflation goes up, do people tend to invest more or less? Most importantly, how does inflation affect the indices of the stock market, especially the Nifty and the Sensex?

     Let’s look in more depth at each of these points. As one of the biggest share broker companies Zebu has a huge team working to make your trading and investment journey as seamless as possible in our efforts to do that we offer the best trading accounts with lowest brokerage for every trade you make.

    1. How inflation affects the amount of money investors can spend What does it mean for prices to go up? Inflation is when the prices of goods and services go up over and over again. In India, the CPI inflation and the WPI inflation are used to measure both retail inflation and producer inflation. Usually, the CPI is a better way to measure consumer inflation because it is more accurate and has more to do with buying power. As inflation goes up, the value of the money you will get in the future goes down. That’s what the “present value” of money means. When inflation is 5%, your Rs.100 receivable from a year from now is worth Rs.95 today. When inflation is 10%, your Rs.100 receivable from a year from now is only worth Rs.90 today. With the same amount of money, you can buy less when your purchasing power goes down. This is usually bad for consumer-driven stocks like FMCG and consumer durables because people’s ability to pay goes down. This means that these companies will have to lower prices and make less money.

    2. Inflation affects interest rates, which in turn affects prices. What happens to bonds and stocks when the inflation rate goes up? Let’s start with bonds. When the rate of inflation goes up, so do interest rates or bond yields. We’ve seen this happen in the last six months, when inflation expectations have gone up and bond yields have gone up sharply by 125 basis points. So that the Yield To Maturity or total rate of return of these bonds stays about the same, when bond yields go up, bond prices will go down. When the price of a bond goes down, people who own bonds, like banks and people with mutual funds, lose money. This is why banks tend to lose money when interest rates go up.

    How about stocks? When both inflation and interest rates go up, the cost of capital goes up as well. The cost of capital is the sum of the costs of equity and debt. And when bond yields go up, the cost of running a business goes up. This means that the company’s future cash flows will be worth less. We know that future cash flows are taken into account when figuring out how much a stock is worth. When the rate of discounting goes up, it makes sense that the value of an equity will go down. In a strange way, higher inflation is good for stocks in the medium to long term. Even though inflation may be bad for bonds and stocks in theory, we can’t forget that it also has a good side. Usually, rising inflation means that GDP growth is getting better.


    Title Page Separator Site title

    Even in the US and Japan, the big economic battle is all about getting inflation back to the 2% level. That is thought to be the level where growth will start to happen. In fact, if you look at the growth of the world and even India over the last 20 years, the GDP has never grown significantly when inflation was low. Even though ridiculously high inflation can make it hard to buy things, a certain level of inflation is needed to encourage businesses and producers. So the real problem is inflation which gets too high. At Zebu, we have a huge team working to make your trading and investment journey as seamless as possible in our efforts to do that, we offer the best trading accounts with lowest brokerage for every trade you make.

  • What Are Microeconomics and Macroeconomics?

    Studying economics can help you understand the potential effects of economic policies on diverse industries. Economics is a tool that can help you predict macroeconomic conditions and understand the impact of those forecasts on businesses, equities, and financial markets.

    When you study the economy as a whole, it is called macroeconomics and when you inspect each aspect of the economy individually, it is called microeconomics.

    Let us now examine what they are.

    Microeconomics

    Microeconomics studies decisions made by individuals, firms, homes, workers, etc.

    Assume you and your family eat onion pakora every day. But you see that onion prices are increasing dramatically every day. So, you call for a family meeting and decide that you will eat onion pakoras only once in three days. While your family might not enjoy the decision, they agree since they contribute to the family finances equally.

    Microeconomics is the study of how specific changes in commodity prices can cause a person or corporation to change its behaviour.

    Macroeconomics

    Microeconomics, on the other hand, is concerned with parameters such as inflation, growth, inter-country trade, and unemployment.

    Microeconomics and macroeconomics are mutually beneficial.

    Microeconomics is a bottom-up method in which individuals and enterprises are examined first, then an industry, and finally the country.

    Macroeconomics is a top-down method in which the country is examined first, followed by the industry, and finally individuals or businesses. Macroeconomic considerations have a significant impact on stock market growth and success.

    What are the factors that macroeconomics looks at?
    It focuses more on elements such as GDP, unemployment rate, inflation, interest rate, government debt, economic cycles, and so on.