Tag: market trends

  • Three Of The Most Commonly Used Pullback Strategies

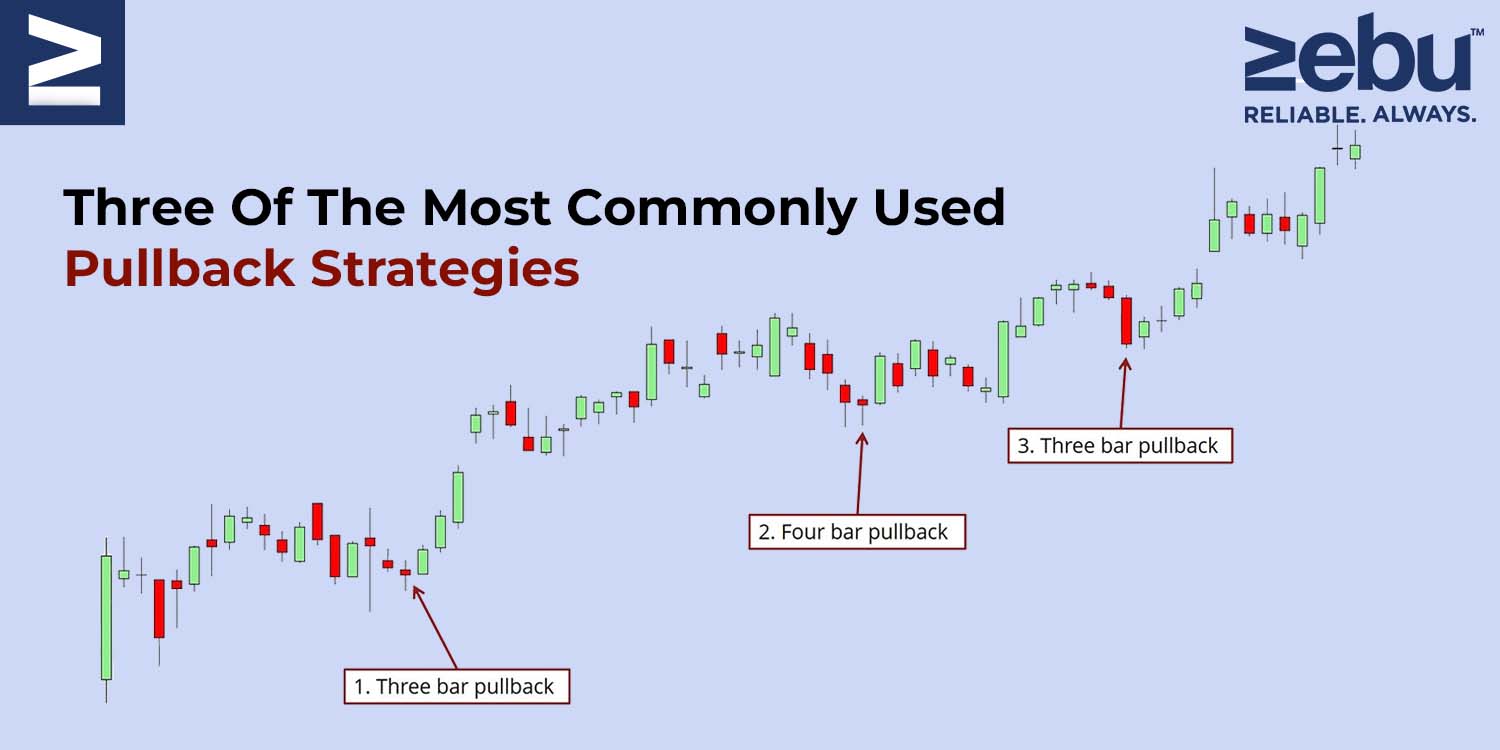
    Are you aware that one of the most fundamental trading methods is to trade trend pullbacks? Yes! There are numerous strategies to earn from pullback trading.

    You may profit from trading pullbacks across all time frames. This is because a trend can occur on any time scale, from the 5-minute to the monthly.

    Before we get into commonly used pullback strategies we would like you to know that at Zebu, one of the fastest-growing brokerage firms in the country, we have created the best Indian trading platform with the lowest brokerage for intraday trading.


    In today’s blog, we’ll present six profitable pullback trading strategies, but first, let’s define pullback trading:

    What does the term “Pullback Trading” mean?

    A pullback is a temporary halt or little decline in the price of a stock or commodity that occurs during an ongoing increase.

    A pullback is virtually synonymous with retracement or consolidation. The term “pullback” refers to brief price drops – say, a few consecutive sessions – before the uptrend resumes.

    Following a significant upward price movement, pullbacks are sometimes considered as buying opportunities.

    For instance, following a great earnings report, a stock may have a significant jump before reversing as traders liquidate existing positions. On the other side, positive earnings are a fundamental indicator that the stock will continue to climb.

    Most pullbacks see a security’s price move to a technical support level, such as a moving average or pivot point, before resuming its uptrend. Traders should pay special attention to these important support levels, as a breach below them may indicate a reversal rather than a retreat.

    Now that we understand what pullback trading is, let us explore several tactics for trading pullbacks:

    1. Pullback to a trendline
    Determining the trend’s direction should be quite straightforward. The swing high and low structure is the most straightforward way to recognise a trend.

    An uptrend is defined by a series of higher highs followed by a series of higher lows. Whereas a downtrend is defined by a series of lower lows and lower highs.

    The disadvantage is that trendlines are frequently validated more slowly. Three contact points are required to validate a trendline. You can always link two random locations, but it is only when you reach the third that you have a true trendline.

    As a result, traders can only trade the trendline pullback at the third, fourth, or fifth contact point.

    While trendlines perform well in conjunction with other pullback tactics, as a stand-alone strategy, the trader may miss numerous opportunities if trendline validation takes an extended period of time.

    2. Pullback to moving average

    Without a question, moving averages are one of the most often utilised tools in technical analysis, and they may be used in a variety of ways. Additionally, you can utilise them to trade pullbacks.

    A moving average of 20, 50, or even 100 periods could be used. It is irrelevant because it is entirely dependent on whether you are a short-term or long-term trader.

    Shorter-term traders utilise shorter moving averages to get hints more quickly. Naturally, shorter moving averages are more prone to noise and false signals.

    On the other side, longer-term moving averages move more slowly and are less subject to noise, but may miss short-term trading opportunities. Consider the advantages and downsides for your own trading.

    3. Pullback after a breakout

    Breakout pullbacks are extremely prevalent, and probably the majority of traders trade this price action pattern.

    Pullbacks following breakouts are frequently seen at market turning points, following the price breakout of a consolidation pattern. The most often used consolidation patterns are wedges, triangles, and rectangles.

    Open range breakout is another common strategy. Once the day’s 15 minutes low and high are marked, traders enter a long position once the upper limit is broken on a good volume. In this situation, it would be ideal to wait for a pullback to the vwap or the 15-minute high for a better risk:reward potential.

    As we mentioned before, trading and investments requires the best Indian trading platform and the lowest brokerage for intraday trading.. As one of the best brokerage firms in the country, we have created a powerful trading platform that makes analysis easy for you. To know more about its features, please get in touch with us now

  • Everything You Should Know About Elliot Waves

    In the 1930s, Ralph Nelson Elliott established the Elliott Wave Theory. Elliott argued that stock markets, which are widely assumed to function randomly and chaotically, traded in repeating patterns.

    In this article, we’ll go over seven crucial things that you should know about Elliot Waves. But before we get into that you need to understand that investment is also about choosing the right technologies. As one of the top brokers in share market, we at Zebu offer trading accounts with lowest brokerage, and an online trading platform to help you focus only on executing your strategies efficiently.


    We’ll look at the history of Elliott Wave Theory and how it’s applied to trading in this post.

    Waves

    Elliott suggested that financial market patterns are determined by investors’ dominating psychology. He discovered that swings in popular psychology usually manifested themselves in predictable fractal patterns, or “waves,” in financial markets.

    Market Forecasts Using Wave Patterns

    Elliott made precise stock market predictions based on reliable wave pattern qualities he found. An impulse wave always exhibits a five-wave pattern because it travels in the same direction as the broader trend. On the other hand, a corrective wave net travels in the opposite direction of the main trend. On a smaller scale, five waves can be detected within each of the impulsive waves.

    Interpretation of the Elliott Wave Theory

    Five waves advance in the direction of the primary trend, followed by three waves in the direction of the corrective (totalling a 5-3 move). This 5-3 move is then subdivided into two subdivisions of the following upper wave move.

    While the underlying 5-3 pattern remains consistent, the duration of each wave varies.

    Consider the following chart, which contains eight waves (five net upward and three net downward) labelled 1, 2, 3, 4, 5, A, B, and C.


    The impulse is formed by waves 1, 2, 3, 4, and 5, whereas the correction is formed by waves A, B, and C. The five-wave impulse, in turn, generates wave 1 at the next-largest degree, while the three-wave correction generates wave 2.

    Normally, a corrective wave consists of three independent price movements – two in the direction of the primary correction (A and C) and one in the opposite direction (B). Correction waves 2 and 4 are depicted above. Typically, these waves have the following structure:

    Take note that waves A and C in this illustration move in the direction of the trend at a greater degree, indicating that they are impulsive and composed of five waves. By contrast, Wave B is anti-trend and thus corrective, consisting of three waves.

    When an impulse wave is followed by a corrective wave, an Elliott wave degree containing trends and countertrends is formed.

    As illustrated in the patterns above, five waves do not always go in a net upward direction, and three waves do not always travel in a net downward direction. When the larger-degree trend is downward, for example, the five-wave sequence is downward as well.

    To apply the idea in daily trading, a trader may spot an upward-trending impulse wave, take a long position, and then sell or short the position when the pattern reaches five waves indicating a reversal is likely.

    The Verdict

    Elliott Wave practitioners highlight that just because a market is fractal does not automatically make it predictable. While scientists recognise a tree as a fractal, this does not indicate that the route of each of its branches can be predicted. In terms of practical application, the Elliott Wave Principle, like all other analysis methodologies, has its supporters and critics.

    One of the critical flaws is that practitioners can always blame their chart reading rather than flaws in the theory. Alternatively, there is an open-ended understanding of the duration of a wave.

    As we mentioned before investment is also about choosing the right technologies. As one of the top brokers in share market, we at Zebu offer trading accounts with lowest brokerage, and an online trading platform to help you focus only on executing your strategies efficiently.

  • Five Market Theories You Should Know About

    When it comes to investing, there are several theories on what makes markets tick and what a given market move indicates. The two major Wall Street factions are divided along theoretical lines: those who believe in the efficient market theory and those who believe the market can be defeated. Although this is a basic distinction, other theories attempt to explain and affect the market, as well as investment behaviour.

    If you are interested in investing or trading, then consider Zebu to get started, as a reputed share broker company we offer lowest brokerage options and a seamless online trading platform to help you with your investment journey.


    1. Theorem of Efficient Markets

    The efficient markets hypothesis (EMH) continues to be a point of contention. According to the EMH, the market price of a stock integrates all available information about that stock. This signifies that the stock is priced appropriately until a future event alters the price. Given the uncertainty of the future, a devotee of EMH is significantly better suited to owning a diverse range of companies and gaining from the market’s overall increase. You either believe in it and employ passive, wide market investment strategies, or you dislike it and concentrate on stocks with high growth potential, undervalued assets, and so on.

    Those who oppose EMH refer to Warren Buffett and other investors who have repeatedly outperformed the market by identifying irrational pricing inside the broader market.

    2. The Fifty-Percent Rule

    The fifty-per cent principle predicts that an observed trend will experience a price correction equal to about half to two-thirds of the change in price before continuing. This suggests that if a stock has been rising and gained 20%, it will lose 10% before continuing to increase. This is an extreme example, as this rule is frequently used for the short-term trends on which the technical analysts and traders trade.

    This correction is considered to be a normal component of the trend, as it is typically triggered by fearful investors taking profits early in order to prevent being caught in a true trend reversal later on. If the correction is greater than 50% of the price change, it is interpreted as a sign that the trend has failed and the reverse has occurred early.

    3. The Greater Fool Hypothesis

    According to the greater fool theory, investing is profitable as long as there is a greater fool than yourself willing to purchase the investment at a higher price. This means that you can profit from an overpriced stock as long as another party is prepared to pay a premium to acquire it from you.

    As the market for any investment overheats, you eventually run out of fools. Investing on the basis of the larger fool theory entails disregarding valuations, earnings reports, and all other data. Ignoring data is just as risky as paying too much attention to it, and hence those who believe in the greater fool hypothesis may find themselves on the losing end of a market correction.

    4. The Theory of Odd Lot

    The odd lot hypothesis uses the sale of odd lots — small blocks of shares held by individual investors – to calculate the best time to invest in a firm. When small investors sell out, investors use the odd-lot theory buy-in. The underlying idea is that small investors are frequently incorrect.

    The odd lot theory is a contrarian technique based on a deceptively simple sort of technical analysis – odd-lot sales measurement. How successful an investor or trader is in applying the theory is highly dependent on whether he investigates the fundamentals of the firms the theory suggests or simply buys blindly.

    5. Prospect Theory

    Prospect theory is often referred to as loss aversion theory. According to prospect theory, people’s views of gain and loss are distorted. That is, people are more fearful of loss than of gain. When people are presented with two contrasting prospects, they will choose the one that they believe has a lower probability of ending in a loss over the one that promises the most gains.

    For instance, if you offer a person two investments, one that has returned 5% each year and another that has returned 12%, lost 2.5 per cent, and returned 6% in the same years, the person will choose the 5% investment because he places an irrational premium on the single loss while ignoring the larger gains. Both alternatives in the previous example generate a net total return after three years.

    As a reputed share broker company we offer lowest brokerage options and a seamless online trading platform to help you with your investment journey. Contact Zebu to know more on how to get started on your share market investment journey.

  • 5 Important Technical Analysis Indicators That Investors Should Know

    Technical analysis is useful in a variety of situations. It can be used to trade stocks, futures, and commodities, as well as fixed-income securities, FX, and other financial instruments.

    Technical analysis is the art and science of predicting future prices based on the analysis of historical price movements. Using historical market data, mass investor psychology is examined. The data set comprises information about the price, the date, and the volume.

    A price chart provides the most useful information for reading a historical description of a security’s price movement over time. Charts are significantly more readable than a table of numbers. Volume bars are shown at the bottom of most stock charts. It is simple to recognise market reactions before and after major events, past and present volatility, historical volume or trade levels, and relative strength of the company vs the index using this historical image.

    Before we get into the importance of technical analysis indicators, you need to have the right technologies. At Zebu, one of the fastest-growing brokerage firms in the country, we have created the best Indian trading platform with the lowest brokerage for intraday trading. If you would like to simplify your option trading and investment game, we are here to help you out.

    The following are five indicators that every investor should be aware of:

    1) The Relative Strength Index (RSI)

    The RSI is a momentum oscillator that measures the amount and pace of directional price changes. RSI calculates the momentum of a stock with the rate at which a price rises or falls. The RSI calculates momentum by dividing the number of higher closes by the number of lower closures. The RSI of stocks that have experienced more or stronger positive movements is greater than the RSI of equities that have experienced more or stronger negative changes.

    The indicator has a 70-point top line, a 30-point lower line, and a 50-point dashed mid-line. When a price rises rapidly, it is called overbought at some time (When the RSI crosses 70). Similarly, when the price falls swiftly, it is termed oversold at some point (when the RSI passes 30). The RSI level is a gauge of the stock’s recent trading strength. The slope of the RSI is proportionate to the rate at which a trend changes. The RSI’s move is directly proportional to the degree of the movement.

    2) Moving averages
    In technical analysis, moving averages are one of the oldest and most useful technical indicators. When used in conjunction with other oscillators such as MACD and RSI, moving indicates a trend in a “smoothed” manner and can provide trustworthy signals.

    The three types of moving averages are simple moving average (SMA), exponential moving average (EMA), and weighted moving average (WMA).

    Moving averages for stocks are commonly used for 10 days, 21 days, 50 days, 100 days, and 200 days. The simple moving average is the most widely used moving average (SMA). Single SMAs can be utilised to spot a trend, but we found that using a dual or triple moving average is more effective.

    3) Stochastic Oscillator

    The Stochastic Oscillator is a momentum indicator that depicts the current close’s position in relation to the high and low ranges across a set of periods. Closing levels that are constantly near the top of the range suggest accumulation (buying pressure), while those that are consistently towards the bottom of the range indicate distribution (selling pressure). The premise behind this indicator is that prices tend to close near their highs in an upward-trending market and near their lows in a downward-trending market.

    4. Bollinger Band

    John Bollinger developed Bollinger Bands as a technical trading technique in the early 1980s. Bollinger Bands are used to define high and low points relative to each other. Prices are high in the top band and low in the lower band by definition. This definition can help with pattern recognition and can be used to compare price action to indication behaviour. Bollinger Bands are a series of three curves that are drawn in connection to stock prices. The middle band, which is usually a simple moving average that acts as the base for the higher and lower bands, is a gauge of the intermediate-term trend. Volatility, which is often the standard deviation of the same data used for the average, determines the gap between the upper and lower bands and the central band. You can change the default parameters, which are 20 periods and two standard deviations, to fit your needs.

    5) Parabolic SAR (Parabolic Stop and Reverse)

    SAR, or stop-and-reversal, is a technical analysis strategy that uses a trailing stop and reverse method to discover appropriate exit and entry locations. J. Wells Wilder came up with this strategy. Basically, one should sell if the stock is trading below the parabolic SAR (PSAR). If the stock price is higher than the SAR, it is a good time to buy (or stay long).


    As we mentioned before, investing or trading you need the right tools. We at Zebu offer the best Indian trading platform and the lowest brokerage for intraday trading. As one of the best brokerage firms in the country, we have created a powerful trading platform that makes investing easy for you. To know more about its features, please get in touch with us now.

  • Things To Learn From PayTM IPO

    Paytm is a startup that has gained a lot of attention for the way it has made it possible for Indians to recharge their phones and pay their bills online. Vijay Sharma, the founder, is the face of pure inspiration. He is a typical ‘small-town lad’ who had huge goals and worked late to build his firm. Many in the industry were looking forward to Paytm’s first public offering (IPO), but it fell short of expectations and disappointed most investors. However, like with any failure, there are lessons to be gained from the Paytm IPO disaster, which should be remembered when investing in future IPOs.

    Are you planning to invest? Before you start investing, it is important that you do so with one of the best share brokers in the country. At Zebu, we have the lowest brokerage for investments and also support you with a highly advanced online trading platform to help you analyse stocks and execute your trades.


    The history

    Investing in an IPO should be a well-considered decision, and investors should do their homework before devoting cash to any IPO, whether it is a well-known firm or not. The prospect of an IPO was clearly attractive in the case of Paytm, and the company’s exponential growth after demonetization is well documented. However, the corporation did make several mistakes, which analysts now recognize. Some of the corporate transitions, for example, were savvy and took advantage of opportunities, while others were risky.

    Learning Lesson

    Many experts consider Paytm to be a very new-age business strategy. As a result, the same experts think that when investors choose to join into any transactions with such firms in mind, such as making IPO investments, they must understand the company’s dynamics, understand prospective valuations, and evaluate the company’s future plans and growth strategy. As a result, investors who invest in an IPO cannot blame the IPO’s failure on their own lack of understanding prior to investing.

    The most important thing to remember when investing in an initial public offering (IPO) is to be tremendously confident in the firm. Second, a small number of radical businesses/companies have specialty technology and market share. Although some companies do well, such as Zomato and Nykaa, some do not have such blockbuster lists. The Paytm IPO was expected to be a blockbuster, but values were pushed well past their limitations. Investors frequently make mistakes in how they evaluate a firm and base their assumptions on that, rather than conducting a thorough fundamental analysis.

    Educate yourself and make wise investments.

    Paytm’s stock plummeted by 58 percent after the business was listed on the stock exchange. It went from a $20 billion valuation to a meager $7.8 billion valuation. Now, the company is frantically trying to persuade investors of its steady growth trajectory in the hopes of regaining some funds. However, when it comes to IPO investment, people aren’t thinking about Paytm because the company’s mounting expenses and a global sell-off of its stock have cast a pall over its future prospects.

    Going forward, the most important lesson is to understand the business and then the valuation. If it does not seem fair to you, do not put your hard-earned money into it.


    Two of the most important checklists for first-time traders and investors are the right online trading platform and the lowest brokerage for investments. As one of the best share brokers in the country, we at Zebu will give you all of this and more. To know more about our services and products, please get in touch with us now.

  • The 200 Day Moving Average And Everything You Need To Know About It

    The 200-day moving average, a simple line that is displayed across a chart, is considered an important tool for traders and investors to determine the trend of the market. The indicator shows as a line on a chart that rises and falls in sync with the stock, commodity, or other instrument being charted as longer-term price movements.

    Before you start investing or trading, always consider going with one of the best brokerage firms in the country like Zebu. As a top broker in share market we have created one of the best stock trading platforms, for you to use and invest.

    When the price is above the moving average, the 200-day SMA appears to act as an incredible support level, and when the price is below it, it appears to serve as a resistance level.

    The 200-Day SMA

    The 200-day SMA is often used in stock trading to detect the broad market trend. It covers around 40 weeks of trade. A company is generally regarded to be in an overall uptrend if its price continues above the 200-day SMA on a daily time period. A 255-day moving average, which covers the preceding year’s trade, is a popular alternative to the 200-day SMA.

    The 200-day SMA is a very long-term moving average that is frequently used in conjunction with other, shorter-term moving averages to display not only the market trend but also the strength of the trend as measured by the distance between moving average lines. Comparing the 50-day and 200-day SMAs, for example, is rather frequent.

    When moving average lines converge, it can imply a lack of clear market momentum, but increasing the distance between shorter-term and longer-term moving averages usually implies increased trend strength and market momentum.

    Death Crosses and Golden Crosses

    The 200-day simple moving average is regarded as such an essential trend indicator that a “death cross” occurs when the 50-day SMA crosses below the 200-day SMA, indicating a downtrend for the stock.

    In a similar vein, the crossing of the 50-day SMA to the upside of the 200-day SMA is known as a “golden cross,” and the stock is regarded as “golden,” or almost certain to gain in price, once this occurs.

    SMAs vs. EMAs Simple Moving Averages vs. Exponential Moving Averages
    It’s likely that the 200-day SMA has a self-fulfilling prophecy quality to it; markets respond strongly in response to it partly because so many traders and analysts value it so highly.

    However, some traders prefer to use the exponential moving average (EMA). An EMA provides a higher weight to the most recent trading days than a simple moving average, which is calculated as the average price over the selected time range. For example, the exponential moving average provides current prices a higher weighting than the basic moving average, which gives all values equal weighting. Technical analysts use EMAs and SMAs in comparable ways to recognise trends and identify overbought or oversold markets, despite the differences in methodology.

    How is the SMA calculated?

    The average closing prices of a security over a period of time are used to calculate a simple moving average (SMA). It’s used to smooth out price swings and provide traders a better understanding of trends and reversals.

    How do I find a stock’s 200-day moving average?

    With Zebull Smart Trader from Zebu, you simply have to change the time frame to 1 day and add the moving average indicator. In the settings, you can change the period to 200. This will overlay the 200 day moving average over your chart.

    As one of the top brokers in share market, we have created the best stock trading platform for you to invest in wisely. Our tool is designed to help investors and traders alike to analyse a company with a wide range of indicators and screeners as per your strategy. As one of the best brokerage firms in the country, we invite you to open a trading and investment account with us.

  • The Detailed Guide To Trading With VWAP

    Large Cap vs Mid Cap vs Small Cap: Key Differences That Actually Matter

    The volume-weighted average price (VWAP) is a trading benchmark that shows the average price a security has traded at over the course of a day, depending on both volume and price. VWAP gives you the average pricing of a stock by accounting for one of the most important parameters – volume. How to Work Out the Average Volume-Weighted Price Instead of manually calculating the VWAP, you can simply add it as an indicator to your chart. When it comes to using the right indicators for your trading strategy, you need an online trading platform from one of the fastest-growing stock broker companies in India. Our goal is to give you the best online stock trading experience with every possible indicator that you might need to create your strategy. Getting back to calculating the VWAP – you can follow these steps to compute the VWAP on your own. Assume a 5-minute chart; regardless of the intraday time frame, the formula is the same. Find the stock’s average price for the first five minutes of the trading day. Now, multiply the high, low, and close of a candlestick by three. Multiply by the volume of that time period. In a spreadsheet, enter the result in the price column. Divide this value from the volume for that time period. This will give you the VWAP. Continue to add the price value from each period to the previous values to maintain the VWAP value throughout the day. Subtract this amount from the total volume up to that point. Create columns for cumulative price value and cumulative volume in a spreadsheet to make this easier. What Does VWAP Have to Say to You? The VWAP ratio is used by large institutional purchasers and mutual funds to help them move into and out of companies with as little market impact as feasible. As a result, institutions will try to buy below the VWAP or sell above it whenever possible. As a result of their efforts, the price is pushed back toward the average rather than away from it. VWAP can also be thought of as a trend confirmation tool and you can build a trading strategy around it. They may prefer to open long bets when the price is above VWAP, for example. They may opt to start short positions when the price is below VWAP. Difference Between MA and a VWAP? VWAP and a moving average may appear similar on a chart. The calculations for these two indicators are different. VWAP is calculated by dividing the entire volume by the sum of price multiplied by volume. A simple moving average is calculated by adding closing prices over a set number of periods (say 10) and dividing by the number of periods (10). There is no consideration for volume. The Volume-Weighted Average Price’s Limitations VWAP is a one-day indicator that is reset at the start of each trading day. When attempting to calculate an average VWAP over several days, the average may become distorted from the genuine VWAP reading, as explained above. When institutional buyers decide to buy or sell a stock, the VWAP is an important consideration for them. In strong uptrends, the price may continue to rise for several days without ever or only sometimes falling below the VWAP. Waiting for the price to fall below VWAP may therefore be a missed chance if prices are rapidly rising. VWAP is based on historical data and does not have any inherent prediction or calculation capabilities. Because VWAP is tied to the day’s opening price range, the indicator’s lag grows as the day progresses. This may be observed in how, after 330 minutes (the length of a normal trading session), a 1-minute period VWAP calculation can typically resemble a 390-minute moving average at the end of the trading day. Why Does The VWAP Matter? Traders who want to get a smoothed-out indication of a security’s price over time utilise the VWAP. Larger traders that need to make sure their trades don’t alter the price of the security they’re seeking to purchase or sell use it as well. To prevent artificially inflating the price of an asset, a hedge fund might refrain from placing a buy order for a price higher than the security’s VWAP. Similarly, it should avoid placing orders that are too low in comparison to the VWAP, so that the price is not driven down by the sale. When used right, VWAP can take your best online stock trading experience and enhance it. With the right online trading platform like Zebull Smart Trader that comes with VWAP and so many other in-built indicators, you can ensure that your strategy is designed to make the most profits. As one of the fastest-growing stock broker companies in the country, we are dedicated to providing you with the best tools for the best trades. Please get in touch with us to know more about our products and services.
  • How Do Economic Sanctions Work?

    It was on Thursday that President Biden announced more sanctions against Russia, this time aimed at its financial sector. Russia’s biggest banks will be cut off from the U.S. financial system, and some of its biggest businesses, such as Gazprom, will not be able to get money from American banks.

    Economic sanctions are penalties that are imposed on a country, its officials, or private citizens, either as punishment or as a way to make people think twice about certain policies and actions.

    Trade embargoes and asset seizures are examples of economic sanctions. They can be used to stop people from going to the country or to stop them from exporting goods. By definition, sanctions are for people who aren’t easily subject to law enforcement by the country that is sanctioning them. For example, as a Russian citizen, President Putin cannot be tried by the law enforcement of the USA. But in order to still hold him accountable for certain actions, sanctions are imposed on his country’s economy.

    Economic sanctions are a policy tool that doesn’t use military force to punish or stop bad behaviour. They can be used all over the world, even if the sanctioning country doesn’t have a border. They can be costly for their targets because they will be cut off from global trade and economies.

    Economic sanctions can also be a weak and ineffective policy tool. They can have little effect on the governments they target and a lot on their most vulnerable citizens.

    It is because the U.S. and the European Union are the world’s biggest economies and trade blocs that they have a lot of power to use sanctions.

    In many ways, sanctions can be put on people, but they can also come in many different forms.

    Economic sanctions can be put in place by a single country or by a group of countries or an international organisation.

    Sanctions can be used in multiple ways

    When a country doesn’t want to trade with you, it puts a “trade embargo” on them. This means that you can’t do business with them, but sometimes there are exceptions for humanitarian reasons. It has been a long time since the United States has banned trade with Cuba, Iran, and North Korea.

    Export controls: Export restrictions stop the sale of certain products, services, and intellectual property to certain countries. They often limit the sale of weapons, technology that can be used in the military, or, as for Russia, oil drilling technologies and equipment.

    Capital controls: these can limit investment in certain countries or industries, or they can make it difficult for a country’s issuers to get money from other countries.
    There are many types of trade sanctions, and they can include import restrictions for certain countries, regions, or industries.

    Asset freezes or seizures: Assets in sanctioning countries can be frozen or seized, which stops them from being sold or taken out of the country.

    Travel restrictions: Officials and private citizens, as well as their immediate families, may not be able to travel to countries that have been punished.

    Examples of sanctions

    Economic sanctions against China include restrictions on U.S. imports from China’s Xinjiang region because of human rights violations against Uighurs.

    In 2014, Russia took Crimea from Ukraine, and the U.S. and the European Union also put sanctions on Russian officials, businesses, and companies because of the move.

    Economic sanctions against apartheid-era South Africa are often said to have played a role in the peaceful transition to majority rule there.

    Sanctions against Saddam Hussein’s Iraq, on the other hand, did not stop him from running the country and were called by some a “humanitarian disaster.”

    In conclusion:

    The success of sanctions can be measured by how well they achieve the policy goals they were set out to achieve, or how much they cost the countries and people they target, if punishment is the goal. They can also make the people of the country they want to punish pay for it, as well as the businesses of the country that is being punished.

    If the goal is to change the behaviour of the countries and people who are being sanctioned, their incentives and options will play at least as big a role as the sanctions’ power.

    For example, in Russia’s case during this war, these sanctions will hurt Russian citizens economically. The Russian index fell more than 45% since the start of the war and sanctions are an indirect way of putting pressure on Russian citizens to oppose the rule of the President.

  • A Quick Guide To Price Action Trading

    Price action is the study of market price movement. Why not examine, analyse, and learn from the price itself?

    The price shown on a chart is based on the combined beliefs, knowledge, and actions of market participants. Buyers are in charge if prices rise. Prices falling suggests sellers are in command. In a sideways market, buyers and sellers cannot agree. Also, price action traders ignore fundamental events, believing the markets already know about them. For them, price movement is the best indicator. Price action is employed by everyone from ordinary investors to floor traders and even institutions. Price action is a fantastic approach to look at markets.

    Many believe that prices move based on public opinion. Because people can have opposing views while trading in the same market. There are two types of traders: those that buy an instrument when the price is approaching a resistance level, and those who wait to see if the price bounces off or breaks through. In any case, both traders appear to be wrong since they lack market knowledge and appear to be following the crowd. The financial markets are fundamentally unpredictable, making future price movements impossible to predict.

    Trading price action strategies requires the best Indian trading platform with a wide range of features. With Zebu, one of the best stock brokers in the country, your online stock trading journey will be drastically enha

    How to trade with price action

    Many price action trading methods use a two-step procedure to discover and exploit market trading opportunities.

    Find out what’s going on now.
    As previously stated, a market can go up, down, or sideways. Looking at the prices of various assets should reveal the market’s movement.

    Find the optimal trading moment.
    After determining the current market conditions, a trader looks for a profitable trading opportunity. If prices are rising, the price action should indicate whether prices will continue to rise or if a correction is imminent. For example, consider a price action trade in Reliance. Assume that INR 2,500 is a resistance. A price-action trader would wait for a break of INR 2,500 to buy Reliance. If it breaks out above INR 2,500, the stop loss would be below the previous support of INR 2,400.

    Most price action traders enjoy candlestick charts because they are informative and visually appealing. A candlestick shows the high, low, opening, and closing prices of an asset through time. A candle that closes higher than its initial price is green (bullish), while one that closes lower is red (bearish).

    By closely examining the prices, a price action trader can learn a lot about how the market operates. The size and information provided by a candle are determined by the pricing points used to create it. As a result, some candle types display bullish hammer, bearish hanging man, and neutral Doji. As time passes, a chart shows more and more candlesticks. When candlestick patterns appear on a chart, they reveal more price data.

    When employed correctly, candlestick patterns can show traders how the market moves like “confirmation, reversal, or neutral.”

    In any case, there are patterns that imply the dominating tendency will continue.

    Head and shoulders and double bottoms are reversal patterns that indicate the current trend is poised to reverse. Neutral patterns, like symmetrical triangles, can occur in any market and, while they indicate a major shift, they provide no direction.

    It’s more important to understand what they say than how they were made. Price action traders can utilise trendlines to find the right entry and exit.

    Price Action Patterns

    In price action tactics, you can find out what individuals are thinking by watching price fluctuations. These are some of the market’s most reliable price action setups.

    A long wick
    A candle has a body and wick(s). This is the distance between the opening and closing prices (the high and the low). Long wick candles are prized by price action traders because they reveal price movement. During that period, buyers tried to drive prices up, but sellers fought back, bringing prices back to where they started the day. A price action trader can now either back the sellers or wait for more proof. No matter how they seem, long wick candles are vital to price action traders.

    Inside bar
    Traders wonder if breakouts are legitimate when they occur. The term “within” refers to when one or more candles trade inside the major breakout candle’s high and low positions. This is called an inside bar. If an inside bar occurs after a breakout, it is a sign of the strength of the breakout according to price action theories.

    Trading Trendlines
    Trendline trading is the use of lines to determine the ideal places to enter trades in up or down markets. In an uptrend, a trendline is projected from a swing low to a swing high. It’s a “trend line.” Retracements to the trend line are effective entry points. In a ranging market, horizontal trendlines might identify support and resistance zones.

    Essentially, price action trading can be used to locate and trade low-risk, high-reward trades.

    If you are a price action trader or want to get started with this concept, you need the best Indian trading platform from the best stock broker to back you up. With our state-of-the-art platform, you can take your online stock trading to the next level. To know more about our products and services, please get in touch with us.

  • 5 Things To Keep In Mind During Volatile Markets

    Right as we are escaping the third wave of a pandemic, we find ourselves in the midst of a war. And naturally, that has made global markets topple and become extremely volatile.

    What exactly is market volatility? Market volatility, in technical terms, refers to the standard deviation of stock market returns from the mean. Volatility is the fluctuations of the stock market in layman’s words. What is the significance of market volatility? It is significant for three reasons. To begin with, market volatility is a measure of risk; the higher the volatility, the higher the market risk. Second, while volatility cannot be avoided, it may be managed. Your volatility plan will come in handy in this situation. Finally, there is an inverse link between stock market volatility and returns. Higher returns are associated with lower volatility, and vice versa.

    When the Nifty index is compared to the VIX, or volatility index, the dramatic surge in the Nifty after 2009 has been accompanied by a continuous and secular decline in the VIX. Similarly, the Nifty had reached a long-term bottom when the VIX reached a peak in 2008. So, how should you invest in volatile markets, given that volatility cannot be avoided entirely?

    Before we get started, it is our duty, as an online stock broker, to caution you about keeping your capital safe in a volatile market. However, if have advanced knowledge about a volatile market, you can make use of it to drastically improve your profits. That is why we have created a high-end online trading platform with the lowest brokerage for you to maximise your returns from the market.

    Here are five simple yet effective methods to manage a volatile market.

    1. Stick to your financial strategy

    That is the first and most important thing to remember. If you look at the VIX chart over the last several years, you’ll notice that it’s been on a secular downward trend. However, if you look at the interim period, you’ll notice that there have been at least 8-10 occasions when volatility has risen significantly. The main point is to stick to your long-term financial plan. This strategy is geared at your long-term objectives and has some built-in safeguards to deal with market volatility. The systematic investment plan (SIP), for example, is meant to take advantage of market volatility. SIPs are critical to ensuring that the power of compounding works in your favour because they are the foundation of your financial strategy. If you look at the performance of SIPs over the last 9 years, you’ll notice that they’ve outperformed the index because they’ve taken advantage of market volatility.

    2. Focus more on quality and less on risk

    This is in relation to your stock and stock mutual fund holdings. We usually add more mid-caps, small caps, sector funds, thematic funds, and so on when the markets are on a roll. When the markets are turbulent, never take on too much concentration risk. Second, look for stocks that have a history of strong levels of transparency and corporate governance. In a volatile market, they’re your greatest bets. Third, concentrate on high-growth equities, high-margin enterprises, and industry leaders. In times of market volatility, they are the most likely to outperform.

    3. Hedge with derivatives

    Futures and options are seen by many investors as a low-margin alternative to cash market trading. They are, in fact, great risk management tools. These derivative products should be used most effectively in volatile markets. When you’re long on equities in a turbulent market, for example, you can use futures to lock in profits while still benefiting from roll premiums. Second, you can utilise put options to hedge your risk, as well as beta hedging with index futures to lower your portfolio’s risk. If you’re ready to be a little more daring and aggressive, volatility tactics like straddles and strangles can help you take advantage of tumultuous markets. In these uncertain times, you have a lot of options.

    4. Make sure your asset mix is well-balanced

    When markets are volatile, how do you manage your asset mix? During volatile times, certain assets do not exhibit the same level of volatility as equities. When equities indexes are turbulent, for example, debt markets tend to be more stable. As a result, having debt in your portfolio gives stability and the security of a steady stream of income. Gold, on the other hand, usually benefits from macroeconomic volatility. In these turbulent times, increasing your gold exposure through gold ETFs or SGBs can be beneficial. The moral of the storey is to keep your asset mix varied to combat volatility.

    5. If in doubt, don’t do anything.

    Traders typically believe that there are only two trading methods to master: when to buy and when to sell. Actually, there is a third option: doing nothing. It is quite easy to be enticed into the market by the prospect of making money off a volatile market. The general guideline is that if you don’t understand the market’s undertone, you should stay out of it. Staying out at the correct time and doing nothing can be a crucial element of strategy in unpredictable markets.

    As a fast-growing online stock broker, we at Zebu always watch out for our investors and traders. If you choose to execute safe strategies during this volatile time, we back you up with the lowest brokerage possible. To know more about our state-of-the-art online trading platform and its features, please get in touch with us now