Tag: Risk Assessment

  • Tips To Determine If The Market Is Overvalued

    There are several signs that the market gives before going into a correction or even a bear market. If you do your research, you might notice these signs and shield your portfolio from losses. Read on to know more.

    Peak valuations: During a stock market bubble, prices go up because of how people feel about the market and because they follow the crowd. Prices are too high compared to what they are worth. Simply put, this means that a company’s fundamentals aren’t getting better as fast as the price of its stock.

    High leverage: Speculators can borrow money from brokerage firms (on margin) or NBFCs to keep the bull market going. Due to the high margin and the never-ending cycle of debt, when stocks go down, investors’ wealth may be completely wiped out.

    Low-interest rates: They are one way that the government encourages people to borrow money and invest. It also encourages FDI or FPI, which are two types of foreign investment. It doesn’t work well with the stock market. This means that when interest rates go down, the market goes up.

    Trend Popularization- There are times when stories about bull markets are told too often. When the media talk a lot about certain stocks, their prices go up a lot. This is called a bubble.

    A lot of IPOs that were oversubscribed—Given how things are, there have been a lot of IPOs in the last two years, and 90% of them were oversubscribed, which shows how bullish the market is.

    Market Capitalization to GDP Ratio: This metric shows how much a country’s stock market is worth compared to its GDP. India has a market cap that is more than 75% of its GDP. This means that the Indian stock market is worth 75% of the country’s GDP.

    PE Ratio: The PE ratio is a good way to tell if the stock market or a company is overvalued.

    Most of the time, the Nifty PE ratio is between 15 and 25. If the PE ratio goes below 20, you could say that the market is undervalued. A PE ratio of 20 to 25 means that the market is fairly priced. If the PE ratio is more than 25, it means that the stocks are overpriced. Let’s look at an example of this to help you understand it better.

    Several other indicators, such as the Buffet Indicator, the SmallCap Index, and the Sensitivity Index, can also be used to spot a stock market bubble. Even so, you can’t always count on these signs to accurately predict the bubble.

    What causes the stock market to drop?

    A correction will happen if investors start selling stocks in large numbers because of something like changes in the global economy, rising inflation, a slowdown in economic growth, or even selling out of fear or panic. When a certain number of investors start selling, it causes more investors to do the same. This is called a spiraling effect.

  • What Should You Consider While Backtesting A Strategy – Part 2

    Sharpe Ratio: The risk-adjusted returns, or reward-to-risk ratio, is found by dividing the annualised return by the annualised volatility.
    With the Kindino Ratio, negative returns are taken into account by dividing the annualised return by the annualised volatility of negative returns.

    In the last section, we talked about how volatility was a way to measure risk. We have these two measurements because we know that not all risks are bad. Sharpe looks at all kinds of volatility, while Sortino only looks at downside volatility. Here is where they part ways. Most of the time, you want a high Sharpe and a high Sortino.

    The right way to count costs

    When analysing trading techniques, it’s also important to think about how much it costs to make the trades that need to be made. One of the main reasons for this is that beginners often think their techniques are better than they really are.

    Many quants think that the only costs of a trading strategy are the commissions that have to be paid to brokers. Two more important examples are:

    Commissions

    As you may already know, it’s hard to trade without a broker. In exchange for money, brokers provide transaction services and act as an exchange. Brokers sometimes add on extra costs and fees that you might not expect. This includes any extra services, fees set by the exchange, and taxes the government might charge for the financial transaction.

    Slippage

    Slippage is a key feature that is often overlooked when evaluating. Slippage is when the price you wanted to trade at is different from the price you actually trade at.

    Why do these prices vary from each other? There could be many things going on. For example, you might have wanted to buy 100 shares of Apple at $100 each, but only 50 people were willing to sell at that price and another 50 at $101. Your loss would have been 50 cents, and the price you would have traded at is 100.50.

    Slippage, which is part of transaction costs, can quickly turn a strategy that should be profitable in theory into one that doesn’t work. In the previous example, if you had planned to sell your shares for 102 dollars, slippage would have cut your profit by 25%. Slippage can be reduced by making a good plan for execution, but it’s important to know how it might affect your deals.

    A few words about the biases we all have

    Everything comes from within, including both profit and loss. Even though the market and how volatile it is play a big role in how much money we make or lose, we always let an inner voice guide us when we make a trade. Some of these voices can be helpful, but most of the time they come from people’s biases. We often feel a wide range of emotions and have to make decisions we weren’t supposed to make because of these kinds of personal biases. We need to control our emotions and personal preferences if we want to know when to stop a trade and when to keep going with it.

    We can’t make good decisions when we’re feeling a lot of different emotions, so these are important things to look at when judging a trading strategy. Some emotions that can make it hard to think straight are excitement, thrill, hope, fear, worry, and panic. These are the emotions that drive us, so keeping an eye on them when it makes sense will always help us do better in a trade.

    If you want more information on this, we also have a page about biases in backtesting and risk management. This will tell you more about your own biases and how to avoid them so you can trade better.

    Most of the time, these are some of the things that are used to judge a trading strategy. Don’t be afraid to write things down as you try to use them in your plan. Once you’ve looked at the results, you can start making changes to improve the way your transactions work.

  • What Should You Consider While Backtesting A Strategy – Part 1

    Backtesting is a very useful way to figure out how our trading algorithms might work in real life (might is the key word). But it can be hard for a data scientist who doesn’t have a background in finance to understand what it all means. Sharpies or Sortinos? Returns or profitability with money? This shouldn’t stop you, though, because some of the best funds in the world are run by people who aren’t in finance. Instead, it’s time to learn.

    In this article, we’ll talk about some of the most important ways to tell if your trading strategy is working or not. If you really understand these basic indicators, you’ll have a good basis for judging different strategies.

    Setting Up Performance Measures

    These are some of the first criteria or measures you could use to figure out how well your trades are going. Most of the time, the measurements focus on two important parts of a strategy: the change in the value of the portfolio and the risk of making those gains or losses. By understanding these two things, you can figure out what it does well and where it falls short.

    Financial metrics

    All of the metrics in this section tell you how much money you made (or lost) when you used a certain strategy. The final amount of money is a good place to start, but there are other signs that give us more information:

    Annualized Return: The average annual percent profit from your trading strategy (or loss).

    Win/Loss, Average Win/Loss: Total (or Average) (or Average) Profits from Trades That Work The total (or average) amount of money lost on trades that go wrong.

    % Profitability is the number of profitable trades out of all of them.

    When we talk about return on capital as a percentage, we usually mean that the strategy is a multiplier on your initial capital. This is helpful most of the time, but we should remember that it’s only partly true.

    Next, if we want to fully understand a strategy, we need to know how we are making money. For instance, do we consistently make tiny wins or do we consistently make small wins followed by massive losses? By looking at different combinations of profitability, win/loss, and profit/loss, we might start to understand how our plan will work.

    Metrics that focus on risk

    It’s just as important to see big profits as it is to know that the method could lose money in the long run. “No risk, no reward” is a saying that only winners use. The vast majority of people whose risky bets didn’t pay off don’t say it. Here, the following crucial metrics are important:

    Annualized Volatility: The standard deviation of the model’s daily return over a year. Since volatility is used to quantify risk, a model with a higher vol indicates greater risk.

    Highest Drawdown: The most negative change in the value of the whole portfolio or the biggest drop in PnL. It is based on the biggest difference between the high and the next low before a new high is set.

    Since our backtest will always cover the whole period, drawdown is an important risk factor to think about, but we’re much less likely to keep a losing trade open in real life. If you had bought Amazon stock in 1998, it would have been smart to keep every share and buy as much as you could during the dotcom bust. In reality, not many people would keep going with a deal if their money dropped by 10%, 20%, 40%, 80%, etc.


  • What is Acid Test Ratio And How Can You Use It While Investing?

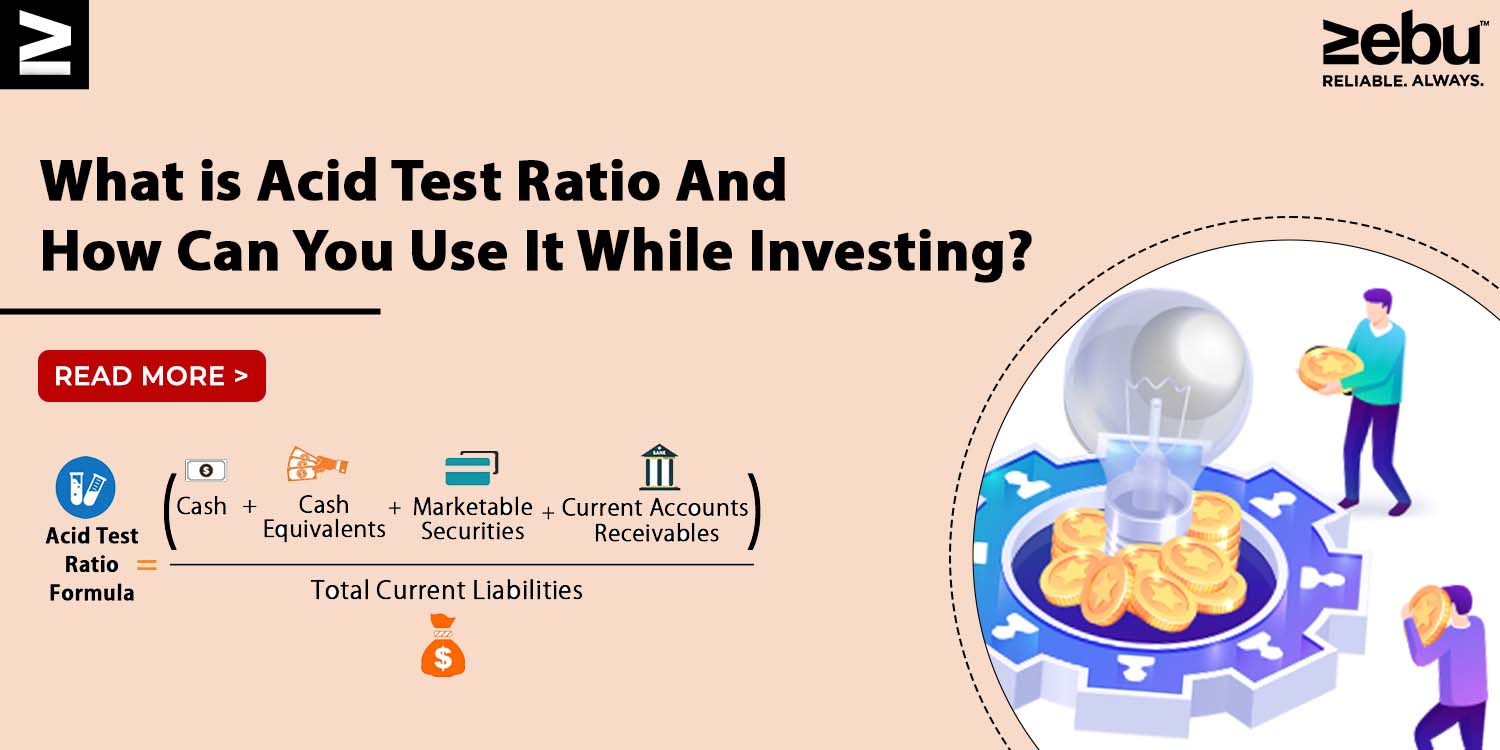
    The acid test ratio, which is also called the quick ratio, is a financial measure of how quickly a company can pay off its current debts. Current obligations are debts that have to be paid back within a year. For example, a credit card balance is a current obligation.

    The ratio shows how well the business is doing financially right now.

    If a company’s acid test ratio is less than one, it usually means that its current assets are not enough to pay off its short-term debts and liabilities. A very high ratio suggests that money has been saved up and is just sitting there, not being put to good use.

    It’s important to know that when figuring out the ratio, the company doesn’t count current assets that are hard to sell quickly.

    How to find the acid test ratio

    The acid-test ratio is calculated by dividing current liabilities by (cash + accounts receivable + short-term investments). Cash and assets that can be used as cash must be included. There must also be marketable securities and other assets that can be used quickly. Accounts receivable are usually covered, but not in every business. If assets on a balance sheet, like loans to suppliers, prepayments, and deferred tax assets, can’t pay off liabilities in the near future, they must be taken off. The denominator should include all current liabilities, which are debts and commitments due within a year.

    The limits of the Ratio

    If the company’s financial data is inaccurate, it will have accounts receivable that require longer than usual to be collected.

    Also, it gives a false picture of the current liabilities that are due but won’t be paid for a while.

    A low acid test ratio doesn’t always mean that a business strategy that depends on stock is in bad financial shape.

    The acid test ratio is different from the current ratio

    The current ratio, also called the working capital ratio, shows how quickly a company can make enough cash to pay off all its debts if they all come due at once.

    On the other hand, the acid test ratio is a more cautious measurement.
    While the current ratio includes assets that can be converted to cash within a year, the acid-test ratio only includes assets that can be done so within 90 days or less.

  • 10 Things You Should Consider Before Investing In An IPO

    Investing in an IPO can be a great way to build wealth with promising companies. However, if last year is anything to go by, IPOs can be extremely tricky to invest in. If you are purely investing in an IPO to benefit from the listing gains, we suggest that you find promising companies, apply to the IPO and sell your shares on the day that it gets listed. However, if you are a long term investor, you can hold on to your gains.

    In this blog, we’ll talk about what an IPO is and the 10 Things to Check Before Investing in them.

    1. Read the Red Herring Prospectus. A company files the Draft Red Herring Prospectus with SEBI when it wants to sell its shares to the public to raise money. This document explains how the company plans to use the money it gets from the public and what risks investors might face. So, people who want to invest in an IPO must read this document first.

    2. Reasons for Raising Money: It’s important to know what the company plans to do with the money it gets from the Initial Public Offering. One should find out if the company wants to pay off its debts or if it wants to raise money to grow the business, or use the money for other business purposes. This shows that the money will be used well in the business, which is a good sign for an investor.

    3. Know the business model: Before investing in the Initial Public Offering, investors should know what kind of business model the company has. Once they know what kind of business the company is in, the next step is to find a new market opportunity. This is because the size of the opportunity and the company’s ability to get a share of the market can make a big difference in the company’s growth and shareholder returns. If investors don’t understand what the company does for business, they shouldn’t buy into its IPO.

    4. Analyzing the background of the company’s management and promoters: It’s important to find out who runs the business since they are the company’s backbone. Investors should look at both the people who started the company and the people who run it since both play important roles in how the company works. The company’s management is a big part of what moves the business forward. One should look at the qualifications and length of time that the company’s top management has been there. This gives an idea of how the company works.

    5. The company’s strengths and weaknesses: Before putting money into a company’s IPO, you should do a SWOT analysis of the company. The DRHP can be used to figure out what the company’s biggest strengths and weaknesses are. Investors should find out where the company stands in the industry it is in. People who want to invest in a business should try to learn as much as they can about the company and the strategies it uses.

    6. The company’s valuation: Investors should also check the company’s valuation, since the offer price could be too low or too high depending on the industries it works in and its financial ratios.

    7. The company’s health: It’s important to look at how well the company has done financially over the past few years to see if the company’s sales or profits have been growing steadily. If the company’s sales are going up, it might be a good idea to invest in its Initial Public Offering. Before putting money into an IPO, investors need to know how healthy the company’s finances are.

    8. Investment Horizon: An investor should know what their investment horizon is before putting money into an IPO. They should decide if they want to buy shares in the IPO just to trade them on the day it is listed or if they want to keep them for a longer time. The reason for this is that a trading strategy would depend on how the market is doing right now, while a long-term strategy would depend on how the company is doing in its core areas.

    9. Comparable Peers: Investors should also look at who the company’s competitors are. The DRHP compares the company to its peers in terms of both its finances and its value. Investors can look at how the company is valued compared to its peers to see if it is priced fairly.

    10. The company’s potential in the market: Investors should also look at the company’s opportunities and threats in the sectors where it operates. This is important for long-term investors to determine if the investment is worth it.

  • Questions To Ask Before You Invest In A Stock

    Investing by yourself for the first few times can become very intimidating, very quick. But considering that taking charge of your finances is the way for independence, it is importantto invest wisely and take risks as per your comfort level.

    Before you invest in a company, you need to understand the fundamentals of a business. If you invest without doing your homework, you are simply gambling. We would also suggest that you ignore WhatsApp recommendations, YouTube recommendations or any other opinion you do not trust.

    Another important factor to consider is the platform you use to analyse stocks and start investing. We suggest that you trust one of the best brokerage firms in the country like Zebu. As a top broker in the share market , we have created one of the best stock trading platforms, for you to use and invest.

    So, before you acquire a share in which you want to invest, here are a few questions to ask. Remember, this isn’t research – it’s pre-research. These questions are vital and fundamental – far from complete, but a good place to start!

    What is the company’s line of business? What does the company do?

    You should have a circle of competency if Warren Buffett does. Indigo Airlines is a carrier, Asian Paints is a paint manufacturer, and HDFC Bank is a bank. Well, none of the stuff is really simple to comprehend, but it is simple to express. Do not purchase if you do not understand what a BPCL or a Bajaj Finance is. If you have to buy something, you should know what it does. Before you buy a stock, the first step is to understand what the company does.

    Is the company paying a dividend or, at the very least, paying income tax?

    A retail investor should avoid investing in companies that are yet to generate a profit. Allow venture capitalists to invest in turnaround companies; it is a distinct kind of skill that you, as a beginner, might not have. The company will pay dividends shortly if it is profitable and paying income taxes, so you may relax. To be even safer, only invest in firms that offer dividends. At the very least, you know that the cash flows you witness are real.

    What has been the company’s track record?

    Take a look at the last two years. Examine the quarterly reports, as well as the balance sheet and director’s reports over the previous three years. Check to see if the company could glimpse into the future and foresee what will happen. Take a look at what they said and did. See if you can determine whether the company’s success was due to luck or strategy. It won’t be easy but you can start with the basics of fundamental analysis to understand a few of the company’s numbers.

    What is the Price Earnings that it is quoting?

    A PE of 24 or above is considered excessive. Of course, some companies with a lower PE are accessible, and they may also be growing slowly. So, instead of 24, search for a pe that is about 17. Remember that the market might stay at a new high PE for a long time, leading you to believe that “this is the new normal” — using PE is a double-edged sword, but it’s a good place to start.

    What are the rivals’ names and prices?

    If you’re looking for Asian Paints, you’ll also come across Berger Paints. Coming away thinking “these are two fantastic companies” will be challenging, if not impossible. So, if you notice that the entire industry has a high PE, you might want to reconsider your position on the industry and its valuation. Is this company the market leader in its industry? Is it a niche player in a crowded market? Is it a monopolistic sector dominated by a single corporation, or is it a fragmented industry where even the largest player controls less than 10% of the market, like D’Mart and other supermarkets do? Also, keep an eye on the competitors from other countries.

    Who is in charge of the business?

    You could favour family-owned businesses with competent management and strong family values, such as Cholamandalam and Asian Paints. That isn’t to suggest that ITC isn’t a successful company. Or that Equitas will be poorly administered by a group of pals who have known each other for many years!

    What is the dividend policy?

    If you acquire a PSU share, the government could go after the company for a large payout. As a result, you benefit as well. However, some businesses may elect to preserve a large part for future usage, so be cautious.

    Have you noticed any red signs recently?

    Is a director being charged for failing to pay taxes? any other criminal or social blunders/frauds? In these cases, keep your distance.

    There are 9000 businesses on the stock exchange. Approximately 5000 of them are occasionally spotted. Around 200 have reliable financial statements. Your investment needs could be more than met with these 200 companies. We would also suggest choosing from the top 100 stocks on the NSE or the top 200 stocks on the BSE.

    With these questions as the basis for your investment decisions, the next step is to understand the basics of fundamental analysis. At Zebu, we are working on a short and cript fundamental analysis guide that can help you understand a company. As a top broker in the share market, we have created the best stock trading platform for you to invest wisely. Our tool is designed to help investors and traders analyse a company with a wide range of indicators and screeners as per your strategy. As one of the best brokerage firms in the country, we invite you to open a trading and investment account with us.