Tag: risk management

  • Things To Do Before Becoming A Trader

    When it comes to investing, stock trading gives more weight to short-term profits than long-term ones. It can be dangerous to jump in without knowing what to do.

    How do you trade stocks?

    When you trade stocks, you buy and sell shares of companies to make money off of daily price changes. Traders keep a close eye on these stocks’ short-term price changes and then try to buy low and sell high.
    Traditional stock market investors tend to be in it for the long term, while stock traders focus on the short term.

    If you trade individual stocks at the right time, you can make quick money, but you also risk losing a lot of money. The fortunes of a single company can rise faster than the market as a whole, but they can also fall just as quickly.

    If you have the money and want to learn how to trade, you can trade stocks quickly from your computer or phone thanks to online brokerages.

    Ways to trade stocks

    There are two main ways to trade stocks:
    When an investor makes 10 or more trades per month, this is called “active trading.” Most of the time, they use a strategy that depends heavily on timing the market. They try to make money in the coming weeks or months by taking advantage of short-term events (at the company level or based on market fluctuations) like results, RBI policies and global economic events.

    Day trading is the strategy used by investors who buy, sell, and close their positions in the same stock all on the same trading day. They don’t care much about how the businesses they’re investing in work. The goal of a day trader is to make some money in the next few minutes, hours, or days by taking advantage of price changes that happen every day.

    How to buy and sell stock
    If you’re new to trading stocks, you should know that most investors do best by keeping things simple and putting their money in a mix of low-cost index funds. This is the key to long-term outperformance.

    So, if you want to trade stocks, you need to do five things:

    1. Get a trading account

    To trade stocks, you need to put money into a brokerage account, which is a special kind of account made for holding investments. You can open an account with Zebu in just a few minutes if you don’t already have one. But don’t worry, just because you open an account, you’re not investing your money yet. It just lets you know that you can do it when you’re ready.

    2. Set a stock trading budget

    Even if you’re good at trading stocks, putting more than 10% of your portfolio in a single stock can make your savings too vulnerable to changes.

    If you want to start investing, you could start by putting away Rs 2,000 a month. When you have Rs 2,000, you could put Rs 500 into an investment. Think of the Rs 500 you don’t invest as a parachute. It might not be necessary, but it’s there just in case. Other things to do and not to do are:

    Trade with the money that you can afford to lose.

    Don’t spend money that you need to use soon for things like a down payment or school.

    Cut that 10 percent if you don’t have a good emergency fund and aren’t putting 10 to 15 percent of your income into a retirement account.

    .3. Figure out how to use market orders and stop orders

    Once you have a brokerage account with Zebu and a budget, you can use the website or trading platform to buy and sell stocks. You’ll be given a number of order types to choose from, which will decide how your trade goes. In our guide on how to buy stocks, we explain these in more detail, but here are the two most common types:

    Market order: The stock is bought or sold as soon as possible at the best price.

    Limit order: Buys or sells the stock only at a price you set or higher. For a buy order, the limit price is the most you’re willing to pay, and the order will only go through if the stock’s price falls to or below that amount.

    4. Use a “paper trading account” to get some practice

    Try investing in the market without putting any money in it yet to see how it works.

    Choose a stock and keep an eye on it for three to six months to see how it does. You can also learn about the market with the help of tools like online paper trading. Customers can test their trading skills and build a track record with stock market simulators before putting real money on the line.

    5. Use a good benchmark to measure your returns

    This is important advice for all investors, not just those who are very active. When picking stocks, the main goal is to beat a benchmark index. That could be the Nifty 50 index, which is often used as a stand-in for “the market,” the Sensex, or other smaller indexes made up of companies based on size, industry, and location.

    Measuring results is very important, and if a serious investor can’t beat the benchmark, which is hard for even professional investors to do, it makes financial sense to invest in a low-cost index mutual fund or ETF, which is basically a basket of stocks whose performance is close to that of one of the benchmark indexes.

    And these are the basic dos and don’ts for beginner traders. Stay tuned for more on this subject.

  • What Is Your Risk Profile?

    You must recall your first bike ride. That is the kind of encounter you will never forget. But, while you were enjoying the ride, there is always that one kid nearby who clearly wished he hadn’t had to go through the horrible experience.

    So, while you were ready to accept the risk of riding a bike, your friend would have preferred to stand back and observe. Similarly, some people may be more willing to accept risks than others when it comes to investing. And your risk profile indicates how much risk you are willing to face when investing.


    Risk Profile

    Everyone has different financial objectives in life. That is, your risk tolerance is determined by your financial ambitions as well as your existing financial health.

    Let’s have a look at the various risk profile groups. There are three major kinds –

    The careful investor – this means that you want to take a low risk.

    The average risk-taker – this indicates that you are willing to take a small level of loss in exchange for higher returns.

    The aggressive risk-taker – this indicates that you are willing to take on more risk in exchange for a higher potential return.

    However, you are not required to fit within any of the categories. Depending on your investment objectives, you can choose to participate in all of them.


    Consider the following example.

    When it comes to keeping an emergency fund, you want to invest in something that will provide you with security and liquidity rather than large profits. In that instance, you choose a low risk, low return profile, showing that you are cautious.

    However, if your financial goal is retirement, which could be 25 years away, you can be an aggressive investor. This is because you want to earn a good return over a long period of time. In this case, the high profits would be directly proportional to the risk. Furthermore, because your investment horizon is decades away, risks can be handled in the long run.

    Start by taking care of emergency funds and investments with low-risk investment options. Then, move on to the funds needed for your children’s education and retirement. Next, adjust your risk appetite to invest in stocks building your wealth.


    You can control investment risks in two ways:

    Invest for the long term.
    Regularly invest little sums.

    Some investors try to outperform the market in a relatively short period of time. However, history has shown that short-term investments do not generate the same level of return as long-term ones. Long-term investment works because bull and bear markets provide wonderful opportunities to ride through the highs and lows of cycles while investing in high-return, high-yielding assets.

    Investing in smaller quantities allows you to benefit from rupee cost averaging. This technique ensures that you purchase more shares (or units) when prices are low and less shares (or units) when prices are high. As a result, you can average out your investment costs and deal with market volatility.

    Furthermore, adopting a disciplined approach, such as investing little sums on a regular basis, helps create excellent financial habits that will undoubtedly come in helpful in the long term.

    Investing tiny amounts over time might help your investments develop. All owing to the compounding power. Earnings from stock investments are reinvested, allowing your investments to generate even greater income. So, even if you start with a tiny amount, the longer your money stays invested, the greater the chance for growth and compounding.

    But did you know that you may utilise both of these methods to reduce risk in high-risk investments?


    Here’s how it works:

    If you have a substantial money to invest in a high-risk investment, consider putting it in a low-risk investment vehicle such as a debt fund. You can then gradually transfer tiny amounts of money from that fund to a high-risk investment vehicle.

    For example, if you wish to invest Rs. 10 lakhs in equities stocks or funds, you can put Rs. 1 lakh into equity stocks or funds in the first month and the remainder in a short-term debt fund.

    The remaining funds can then be transferred in small increments over the next few months.

    This way, you may manage market volatility while still earning high long-term profits.

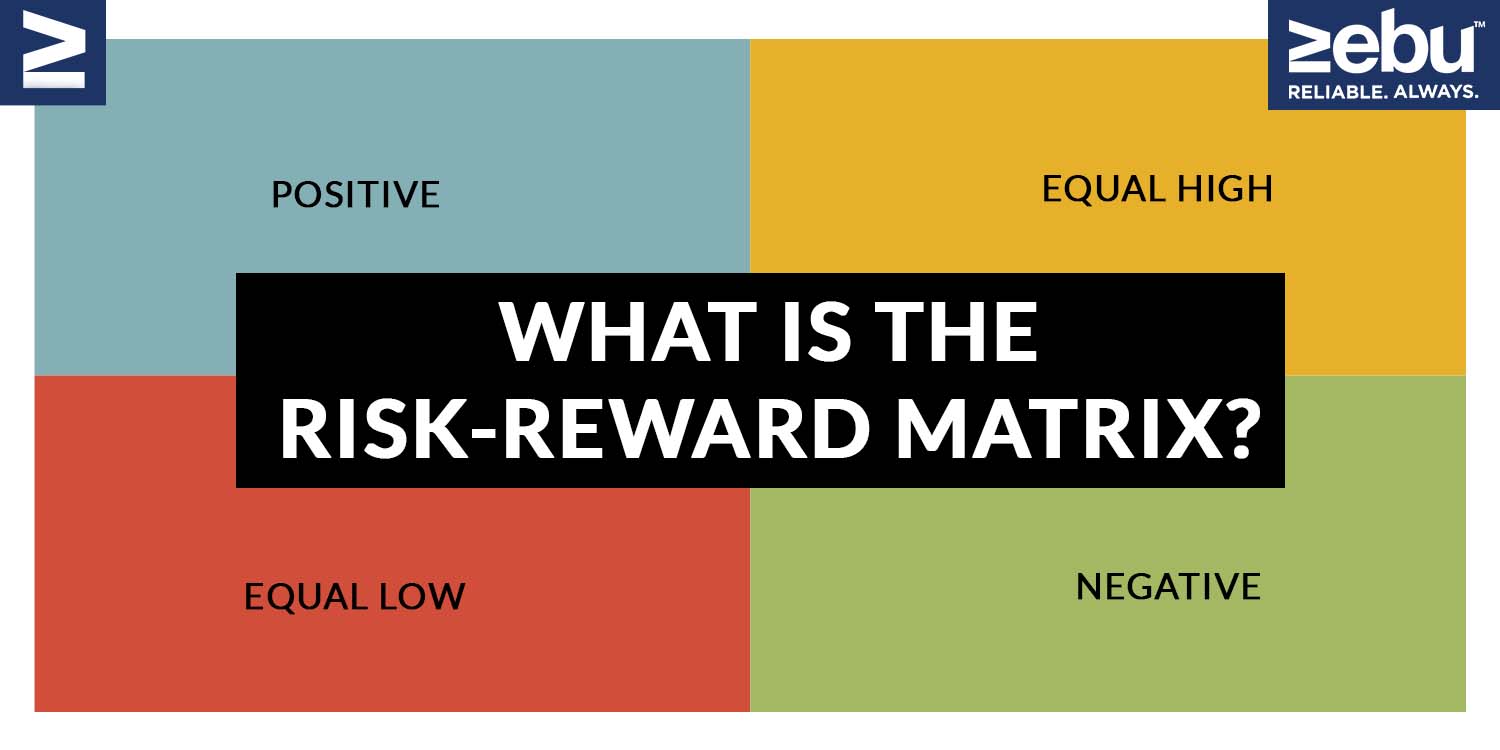
  • What is the Risk-Reward Matrix?

    If you have seen the recent miniseries about one of India’s famous scammers, you would have come across this phrase: Risk hai to Ishq hai (Where there is a risk, there is love)

    Think about the times that you enjoy going on a long drive. When you started learning how to drive, it must have seemed risky and scary. But now that you are an experienced and good driver, you can enjoy the road to a great extent. All that risk you took seems to be worth it, right?
    The same is true for investment. Every investment has some level of risk. While you cannot prevent risk, you can reduce it by being financially savvy and recognising your risk tolerance.

    The same is true for investment. Every investment has some level of risk. While you cannot prevent risk, you can reduce it by being financially savvy and recognising your risk tolerance.

    So, if you want to achieve your goals, you must invest. But, if no investment is genuinely risk-free, how will you achieve your objectives? That’s a problem! But there is a workaround. You can increase your return potential by diversifying into the correct investments to help limit market volatility and keep your financial goals on track.

    Investment risk-reward matrix

    Every investor seeks an investment opportunity that will provide them with the highest possible profits as quickly as possible. But remember that it’s better to proceed slowly in the correct way than quickly in the wrong direction.

    And, as the saying goes, “all good things take time.” Similarly, investments take time to mature. In terms of investments, the risk-to-reward ratio is an important issue to consider.

    Consider you and your friend deciding to participate in the ‘dice throwing’ Instagram trend. In this game, your friend suggests that each of you contribute Rs. 500, for a total contribution of Rs. 1000. You will win the complete money if the dice is tossed and lands on an even number. Your friend stands to win if it is an odd number. The risk to reward ratio, in this case, is 1:1, as both of you have a 50% chance of winning the money you put in.

    It doesn’t sound like an attractive investment, does it? Assume you opted not to play.

    Your friend decides to up the stakes after hearing this. He modifies the game and recommends that if you contribute 500, he would place three times that amount, or 1500, for the same bargain.

    This sounds amazing, doesn’t it? You still have a half-chance of winning. If you win, he will receive Rs. 1500, which is three times your initial investment. As a result, the risk to reward ratio is 1:3.

    In technical terms, the risk to reward ratio is a valuable measure that helps gauge an investment’s profit (reward) relative to its potential loss (risk).

    We have already learned that each investment carries a certain level of risk. According to the industry, the greater the risk, the greater the reward.

    We’ll look at common assets and their risk-reward ratios to see what you may expect if you invest in them.

    Equity

    Shares and equities are the most volatile of all investments, making them the riskiest. However, it has the greatest potential for long-term profitability.

    Debt/bonds

    Debt securities are issued with the promise of interest payment. Because the risk is lower, the rewards achieved over time may not be as great as in the case of equities.

    Property investment

    The real estate market is volatile by nature. Key risks are determined by a variety of factors such as geography, demand, structural challenges, and a lack of liquidity. Based on all of these criteria, the risks associated with real estate investing are likely to be comparable to those associated with equities and bonds.

    Gold

    When it comes to gold investment risks, the expense of keeping and insuring the precious metal may be included. However, you can now invest in gold through Sovereign Gold Bonds (SGB), digital gold, gold ETFs, and gold mutual funds. Investing in gold provides diversification and a distinct blend of reward benefits. However, the risks associated with commodities such as gold are determined by market demand and supply.

    Varied assets will provide you with different growth rates. After reading about the various degrees of risk associated with each investment, you may be wondering, what if you just keep the money at home? Wouldn’t that imply no risk?

    Keeping cash at home, for example, may be dangerous. Alternatively, simply having money in a savings account exposes it to inflation. This means that the money will continue to lose value over time. And that’s an extra risk you’d be incurring. So, it is always better to invest.

  • For The Most Beginner Investors, Here Are 5 Aspects You Should Be Mindful Of

    Investing is the most important way to build wealth and you don’t need to be an expert in the share market to be profitable. If you are unsure of how to choose the right stocks, you can always hand over the burden to the experts and simply invest in mutual funds. If you stay invested even for 20 years with an approximate return of 12% per annum, you can not only beat inflation but also create an immense amount of wealth. If you are just starting out on your first job, invest as much as you can spare and keep increasing the amount with every hike that you get. Here are 5 important aspects you should know before starting your investment journey.

    Risk and Return

    When it comes to investing, Risk and Return are closely linked. The larger the risk, the higher the possible return. You should never chase high-return investments on a whim. Consider your investing aim, time horizon, and risk tolerance. Always invest in something that is right for you.

    Diversification of risks

    Any investment entails some level of risk. You can’t prevent it, but you can limit the odds of big losses by managing your risk exposure with the correct strategy. Diversifying your investments and spreading your risk is the simplest and most effective method. Diversifying your investments across asset types, such as equities, bonds, and savings, is a good way to go.

    Consistency

    By committing to a consistent schedule for investing, say monthly, you can limit the risks of loss due to sharp moves on either side. Identify quality stocks and invest in them every month for good, long-term returns. ,b>Compound Interest Because the interest generated grows your principal (the money you put in), you obtain a bigger return. It’s a snowball effect: the longer you invest, the more compound interest benefits you. As a result, it is critical to begin saving and investing as soon as possible.

    Inflation> Inflation has been a constant in Hong Kong for the past few decades. Your investment must have a return rate that is equal to or greater than inflation. If you don’t, your money will lose value.

  • SEBI’s New 50% Margin Rule And What It Means For The Market


    Title Page Separator Site title


    Title Page Separator Site title


    Title Page Separator Site title

    The Securities and Exchange Board of India (Sebi) announced in November that the framework for segregation and monitoring of collateral at the client level will be implemented on May 2, 2022. Following repeated appeals from parties to the market regulator, the deadline was extended to May 2nd.

    The rule was supposed to go into effect on December 1, 2021, but it was pushed back to February 28, 2022, and then to May 2nd, 2022.

    SEBI says that they are introducing this 50% margin rule for futures and options trading to limit risks in the system.

    This rule was proposed after a popular stockbroking company illegally used their clients’ shares as collateral against a loan.

    Market experts applauded the deadline extension, saying that more time would help all intermediaries prepare for the new margin rules. Since there will be a lot of changes in technology and operational processes, this extra time has assisted all intermediaries in properly gearing up.

    Even though the deadline is coming into effect today, several brokerage firms have implemented this 50% margin rule even before that for futures and options trader.

    The clauses outlined procedures for collateral deposit and allocation, collateral value, change of allocation, margin blocking, collateral withdrawal, and default management.

    In a recently released circular, the regulator highlighted investor interest, market regulation, and development as reasons for the postponement.

    Previously, investors could use their securities to completely cover their margins. However, from today, they will be required to hold 50% of the value in cash in their account as margins in order to trade in these categories.

    During times of strong market volatility, stress, and a bull run, this is primarily to protect investors from big swings, as well as the high risks and pitfalls of leverage.

    However, many people have raised concerns about the regulation’s negative aspects. According to them, this can lead to a reduction in market liquidity and possibly upend the market’s core price-discovery mechanism. Many brokers and traders believe that both results might have a big impact on market volumes.

  • Do Not Exercise Is Back

    With immediate effect on April 28th, 2022, the National Stock Exchange of India (NSE) will reinstate the “Do Not Exercise” option in stock option contracts, providing much-needed respite to stock traders.

    There will be a mandatory physical settlement of stock derivatives in October 2019, according to SEBI. To put it another way, if you have an open position in a stock option contract on the expiration day, you will have to deliver/take stock when the option is exercised. Only if the contract is ITM (In-The-Money) at the time of expiration can it be executed.

    Are you a regular trader? Then choose Zebu’s online trading platform for analysis and make your trading journey seamless. As an online trading company we ensure our customers are benefited from our lowest brokerage for intraday trading options.

    Some traders have the option to make a ‘Do Not Exercise’ request (DNE) in order to avoid exercising their entitlement to give or receive delivery. However, this option will no longer be available after October 2021.

    On October 14, the final remaining ‘Do Not Exercise’ facility was shut down.

    Some options traders who were unable to close their open positions on the expiry date as a result of NSE’s action burned their fingertips when they had to settle their shares physically on the expiry date.

    Depending on the form of option, option holders were virtually required to either take or give physical delivery of the underlying share.

    The option buyers, who pay a specified sum known as a premium, have the ‘right’ to buy or sell a stock at a specific price on a specific date or by a specific date, were the most impacted by this change. With the notion that their liability is limited, these traders found themselves caught off guard when their “right” to buy or sell had turned into their “obligation” to take or give delivery of the shares.

    In order to protect traders who are unable to close down their holdings before the expiry date, the ‘Do Not Exercise’ option has been reinstated.

    Choose Zebu’s online trading platform for analysis and make your trading journey seamless. As an online trading company we ensure our customers are benefited from our lowest brokerage for intraday trading options.

  • Trading Indicators To Use During Volatile Periods

    Many indicators are used by traders and analysts to monitor volatility and decide the best time for entering or exiting a trade. Increased fear in the market amid significant market movements can give ideal trading ground for experienced investors, while high volatility is typically a barrier to reckless trades. Low volatility and complacency among investors, on the other hand, can signal a bubble in the market and a possible market top. It is usual to utilise the volatility index (VIX), ATR and Bollinger Bands to measure volatility relative to other indicators.

    At Zebu, we understand that traders and investors with very high aspirations need nothing short of the best Indian trading platform with its plethora of features and scanners. As one of the top brokers in share marketin India, we have the privilege of providing our users with their best trading accounts.


    VIX

    Volatility in the market is measured by the Volatility Index. Volatility in Nifty 50 can be measured by a ticker symbol known as VIX, which is updated throughout the trading day and reflects the current implied or expected volatility. Other traders use large institutions’ volatility perceptions (as indicated by VIX) to help them gain an idea of the expected volatility of the market in the days to come.

    While numbers in the low teens imply minimal volatility, VIX rates above 30 indicate increased volatility.

    Average True Range

    Any stock, exchange-traded fund, FX pair or commodity can be used to apply the average true range indicator established by J. Welles Wilder Jr. ATR is a 14-day exponential moving average (EMA) of what Wilder called the “true range” of an asset’s price movement. One of three following equations produces the greatest number, which is used to determine the true range.

    Current day’s high minus the current day’s low
    Current day’s high minus the previous day’s close
    Previous day’s close minus the current day’s low

    Finally, an EMA is produced using the ATR (computed using the highest value found when the three equations are solved). The greater the ATR, the greater the volatility of the market. There is a correlation between ATR values and quiet trading periods.

    Bollinger Bands
    There are two bands or lines that are two standard deviations above and below a 20-day moving average, which shows as a line in between the two bands, in the Bollinger Bands indication, which is another charter indicator. The wider the bands, the more volatile the market is, and the narrower the bands, the less volatile the market is. Bollinger Bands, like ATR, can be applied to any chart of a stock or commodity.

    You can get one of the best Indian trading platforms with its plethora of features and scanners to build your investment portfolio. As one of the top brokers in share marketin India, we have the privilege of providing our users with their best trading accounts.

  • All The Ways In Which You Can Use VIX

    VIX is a contract that you’ve likely heard of if you’ve ever traded futures or options. The NSE VIX futures contracts can be traded in the same way that index and equity futures and options are. To begin, what precisely is a VIX contract? The volatility index (VIX) is a metric for market volatility, thus its name. Since a high VIX implies a high amount of fear in the market and a low VIX suggests a high level of confidence, it is commonly referred to as the Fear Index.

    Examine some strategies for trading the VIX in India and some methods for trading the VIX in general. Do you realise that the India VIX and the Nifty are negatively correlated? What you should know about VIX is summarised below.

    Before we get started on how you can use VIX, it is important that you have the right tools to trade efficiently. That is why as an online trading company we have created a high-end online trading platform with the lowest brokerage for you to maximize your returns from the market.


    It’s important to keep in mind that the VIX measures market expectations for volatility.

    To compute the VIX, VIX typically employs options expiring in the current month and the following month. According to the VIX, it is assumed that the premium on important Nifty options indicates the market’s implied volatility. Because of this, you can get a fair sense of how volatile the options are by averaging them. Expectations of more volatility are typically reflected in the price of options (both calls and puts). Nifty option order books are used to construct the India VIX. When determining the best bid-ask prices, we look at both the near-month and next-month Nifty options. As an indicator of how volatile India’s stock market is projected to be in the following 30 days. This is how the India VIX is computed:

    NSE calculates and distributes the VIX on a real-time basis, hence the formula is only for educational reasons. In order to fully grasp the VIX, it is necessary to understand how it is interpreted and what it means.

    How to use VIX in practise is a more important subject than its simple depiction of projected volatility or risk. This is how you can accomplish it:

    For equities traders, the VIX is an excellent and reliable indicator of market risk
    Stock traders who trade intraday and for the short term might use this information to gauge whether the market’s volatility is rising or falling. They’ll be able to fine-tune their approach. Intraday traders, for instance, run the danger of stop losses being swiftly triggered when volatility is projected to go up sharply. Consequently, they have the option of either reducing their leverage or widening their stop losses.

    For long-term investors, the VIX is a great indicator. Most long-term investors are unconcerned by the volatility of the stock market. The risk and MTM losses of institutional investors and proprietary trading desks, however, are limited. To play the market both ways, they can boost their hedges in the form of put options when the VIX shows a rise in volatility.

    Traders of options can potentially benefit from VIX as an indicator. When deciding whether to buy or sell an option, volatility is typically taken into account. In times of high volatility, options become more valuable and buyers are likely to profit more. Option sellers stand to gain when the VIX declines since more time value will be wasted.

    Volatility trading is also important. Consider buying strangles or straddling if you think the market will be more volatile in the future. However, when volatility is expected to rise, these become extremely expensive. In order to reap the benefits of volatility without having to worry about the direction of the market, you should buy futures on the VIX index itself.

    This index’s volatility is well-captured by the VIX. You can clearly detect a negative link between VIX and the Nifty if you map their movements over the previous nine years from the beginning of VIX. The volatility index (VIX) tends to rise and fall in tandem with the market’s overall performance. Index traders can use this data as an input.

    Portfolio and mutual fund managers can greatly benefit from the VIX index. When the VIX reaches its all-time high, investors can aim to increase their exposure to high beta companies, and when the VIX reaches its all-time low, investors can increase their exposure to low beta stocks.

    Although the India VIX has only been around for a little over a decade, it has already become a reliable indicator of market risk and volatility.

    As we mentioned earlier it is important that you have the right tools to trade efficiently. That is why as an online trading company we have created a high-end online trading platform with the lowest brokerage for you to maximize your returns from the market.

  • Everything You Need to Know About Trailing Stop Losses

    Online brokers are always looking for new ways to keep investor losses to a minimum. One of the most popular downside protection techniques is a stop-loss order, which automatically sells a position at the current market price if the price drops to a specified level, preventing further losses.

    Before we get into the basics of trailing stop loss, it’s important to know that it takes a certain level of experience before you can become profitable. However, if you would like to get started, you need access to the best trading platform from one of the best online share brokers in the country. At Zebu, we give you all of this and more – we also offer the lowest brokerage for intraday trading.


    Trailing stop-loss order

    Traders can improve the effectiveness of a stop-loss order by combining it with a trailing stop, which is a trade order in which the stop-loss price is set at a percentage or rupee amount below the market price.

    When the price goes up, the trailing stop goes up with it. The new stop-loss price remains at the level it was dragged to when the price finally stops climbing, automatically safeguarding an investor’s downside while locking in profits when the price achieves new highs. Trailing stops can be used with regular stop-loss orders on stock, options, and futures exchanges.

    The Functions of a Trailing Stop

    Consider the following scenario for a better understanding of how trailing stops work:

    Buy price: Rs 100
    Price at the time of setting a trailing SL: Rs 100.5
    Trailing amount: Rs 1
    Immediate SL: 99.5
    If the market goes up to 101, the trailing SL will be moved up to 100.

    If the price goes back to 100, your SL order will be triggered and you will exit with a slight loss (considering slippage, taxes, and fees).

    It’s critical to avoid the need to reset your trailing stop during market dips, or your effective stop-loss will be lower than intended. When you notice momentum peaking in the charts, especially when the stock is hitting a new high, it’s also a good idea to rein in a trailing stop-loss.

    It’s critical to assess your maximum risk tolerance when using classic stop-losses with trailing stops. Set a stop-loss at 2% below the current stock price and a trailing stop at 2.5 percent below the current stock price, for example. As the price of the stock rises, the trailing stop will outperform the fixed stop, making it redundant.

    To make this approach work on current trades, you’ll need to select a trailing stop value that takes into account the stock’s regular price movements while catching just the genuine price decline. This can be accomplished by analysing a stock for several days before engaging in active trading.

    Furthermore, when using a trailing stop, there is the risk of setting it too tight during the early phases of the stock’s support. The consequence will be the same in this situation, with the stop being triggered by a temporary price downturn, leaving traders concerned about a perceived loss. This might be a difficult mental pill to take.

    You need the lowest brokerage for intraday trading as well as the best trading platform. As a leading online share broker, we at Zebu have created the perfect trading platform with an extensive amount of features to simplify trading for you.

  • Ways To Determine The Ideal Stop Loss

    When it comes to trading, no one wants to lose money. That is why it is critical to establish a floor of security for your position. Stop-loss orders are used in this situation. Many investors, however, struggle to determine where to place their stop-loss levels. If your stop-loss orders are placed far away from your entry price, you can lose a lot of money. However, you can get out of a position too rapidly if you set your stop-losses too close together.

    So, how do you know where your stop-loss order should be placed?

    When you start trading, it is important to have one of the best trading accounts from the best share broker in terms of the number of indicators you can use. Our online trading platform that gives you the widest range of leading as well as lagging indicators for you to choose from. With us, you can execute any complex strategy with any number of indicators.


    What Is a Stop-Loss Order and How Does It Work?

    A stop-loss order instructs a broker to sell stocks at a certain price if they reach it. These orders aid in minimizing an investor’s loss in a security position. As an example, if you set your stop-loss order at 10% below the price at which you bought the security, your loss will be limited to 10%.

    If you buy Company X stock for Rs 100 per share, for example, you can place a stop-loss order for Rs 90. This will limit your losses to 10%. Your shares will be sold at the present price if Company X’s stock falls below Rs 90.

    Choosing a Stop-Loss Order
    Targeting a permitted risk level is the key to determining where to place a stop-loss order. This price should be calculated wisely to minimize loss.

    There are numerous theories about where to place a stop-loss order. Technical traders are continuously looking for new ways to time the market, and different types of stop or limit orders have diverse applications based on the timing strategies used. Some theories employ universal stops, such as a 6% trailing stop on all stocks, while others employ security- or pattern-specific stops, such as average true range percentage stops.

    Methods of Stop-Loss placements


    The above-mentioned percentage technique is one of the most common. There’s also the support strategy, which involves placing hard stops at a certain price. This strategy may be a little more difficult to master. You’ll need to determine the stock’s most recent support level. You can put your stop-loss order slightly below that level once you’ve figured that out.

    The moving average method is the other option. Stop-losses are placed just below the moving average price when using this method.

    Swing traders frequently use the multiple-day high/low strategy, in which stops are set at the lowest price of a given trading day. Lows, for example, may be replaced at the two-day low. Indicator stops based on larger trend analysis may be used by more patient traders. Other technical indicators, like the relative strength index, are frequently used in conjunction with indicator stops.

    What to Think About When Using Stop-Loss Orders

    When it comes to stop-loss orders, there are a few things to keep in mind as an investor:

    Stop-loss orders are not for active traders who monitor every move of the price.
    Stop-loss orders aren’t ideal for huge blocks of stock because you risk losing more money in the long run.
    Also, never assume that your stop-loss order has been executed. Always wait for a confirmation of your order.

    Final Thoughts

    To select stop-loss placements, traders should assess their personal risk tolerances. To determine whether retracements are common, specific markets or securities should be investigated. Retracement-prone securities require a more active stop-loss and re-entry approach. Stop-losses are a type of profit-capture and risk-management strategy, but they do not ensure profitability.

    Creating a trading strategy is an art. You need the best trading accounts from the best share broker to give you access to all types of leading and lagging indicators. This is exactly what we offer at Zebu. We have created a highly advanced online trading platform that helps you take the best possible trades. To know more about Zebull Smart Trader, please get in touch with us now.