Tag: stock market basics

  • What is Tick Trading? Basics and Key Features

    Written in a fully natural, raw tone to sound real — like something someone would say in conversation, not write for an algorithm.

    You’ve probably seen it happen — you’re watching a stock, and the price just keeps flickering. Up a bit, down a bit. No big move, just tiny shifts every second. That’s what traders call “ticks.” And there’s a style of trading built around exactly that. It’s called tick trading.

    This isn’t some fancy or secret thing. It’s just a way of trading where you focus on every little price change, and make decisions based on that movement. Not time, not indicators, not forecasts — just the actual trades that are happening right now.

    Let’s break it down without overcomplicating it.

    What’s a Tick?

    A tick is the smallest movement a price can make.

    If a stock goes from ₹100.25 to ₹100.30, that’s a 5-paise tick. Some instruments might tick by 10 paise, some by 1 rupee. It depends on the market and the asset.

    But in general, every time the price changes — even a tiny bit — that’s a tick.

    And in tick trading, you’re trying to make money from those little moves.

    What’s a Tick Chart?

    This is where it gets interesting.

    Most traders look at charts based on time — like 1-minute, 5-minute, or hourly charts. But tick traders use charts that update based on the number of trades, not time.

    A 100-tick chart draws a new bar after 100 trades happen. If the market is quiet, that might take a while. If it’s active, that bar forms in a few seconds.

    That means your chart speeds up or slows down depending on how busy the market is — which gives you a better sense of actual trading activity.

    Why Use Tick Charts Instead of Time Charts?

    Time charts are useful, but they can hide what’s really going on when the market gets fast.

    Let’s say you’re using a 1-minute chart. That chart updates every minute, no matter what happens. But in those 60 seconds, the market might have exploded with trades — or gone completely quiet. The candle looks the same size either way.

    Now, a tick chart only updates when a certain number of trades have occurred. So if things are heating up, your chart moves faster. If it’s slow, it cools down. You can actually feel the market’s pace.

    And for a tick trader, that pace is everything.

    So, What Is Tick Trading?

    It’s trading based on the flow of trades — each tick, each change in price, each flash of volume.

    Instead of looking for long-term trends, tick traders look for:

    • Short bursts of momentum
    • Quick reversals
    • Breakouts that last seconds
    • Price patterns forming in real time

    It’s fast. It’s focused. And it’s not about holding overnight or watching the news.

    Tick traders might be in and out in seconds. Some hold for a few minutes. The goal is simple: catch small moves, stack small wins.

    How Do People Trade Using Ticks?

    There’s no single way. But here’s what many tick traders pay attention to:

    • Order flow – who’s buying? who’s selling?
    • Bid-ask spread – how tight is the price range?
    • Volume bursts – is someone suddenly stepping in big?
    • Micro-patterns – things like mini-flags or range breaks
    • Price action – just watching how it behaves

    And a lot of it is about feel. You don’t get that from a textbook. You get it from watching ticks for days or weeks, seeing how a particular instrument moves.

    Some traders even skip indicators altogether. Just raw price and volume.

    Tools You’ll Probably Need

    Tick trading isn’t casual trading. You need a setup that’s fast and responsive.

    • Low-latency trading platform
    • Real-time market data
    • Depth of market (DOM) view
    • Fast order execution
    • Hotkeys or one-click trading

    If your internet lags or your charts freeze, it’s a problem. You’re dealing in milliseconds here. Even a small delay can ruin the setup.

    And yes, many tick traders use algorithmic support — even if it’s just basic rules. Some build bots to enter and exit for them. Others stay manual but use alerts.

    Can Retail Traders Do Tick Trading?

    Yes — but with caution.

    Big institutions have a clear advantage here. They’ve got speed, capital, tech. But individual traders can still participate — especially in high-volume markets like:

    • Nifty futures
    • Bank Nifty
    • Liquid stocks like Reliance, HDFC Bank, etc.
    • USD/INR currency futures

    The key is staying realistic. Don’t expect to win every tick. Don’t overtrade. Start with tiny positions and just observe at first. See how price behaves. Learn when the market breathes — and when it jumps.

    Why Do People Choose This Style?

    Because they like to trade. They enjoy the rhythm. They don’t want to wait hours or days to know if they were right.

    Some say it gives them more control. Others feel it lets them reduce risk — since they’re only exposed for a few seconds or minutes at a time.

    But it’s not easy. Tick trading demands presence. You can’t walk away in the middle of it. You have to focus.

    And not everyone likes that.

    What Are the Risks?

    Plenty.

    • Overtrading – You might get sucked into every little move
    • Emotional fatigue – Constant focus wears you down
    • Slippage – The price you see may not be the price you get
    • Fees – All those small trades add up in costs
    • Whipsaws – Price fakes a move, then reverses fast
    • Burnout – It happens. Tick trading isn’t meant for 8 hours a day.

    That’s why most traders who do this well… don’t do it all day. They pick one or two windows where the market’s active — and that’s it. Done in 30 minutes. Maybe an hour.

    Final Thoughts

    Tick trading isn’t for everyone.

    It’s intense. It’s technical. And it can be unforgiving.

    But if you like short-term price action — if you’re someone who gets more out of one good trade than a full-day of watching — it might be worth exploring.

    Start slow. Watch first. Trade small. And build your understanding one tick at a time.

    It’s not about being right all the time. It’s about reading the rhythm of the market — and reacting with clarity when your moment shows up.

    Disclaimer:
    This blog is for educational use only. It does not offer investment advice or suggest any trading strategy. Tick trading involves high risk and is not suitable for all investors. Please consult a licensed advisor before acting on any financial information.
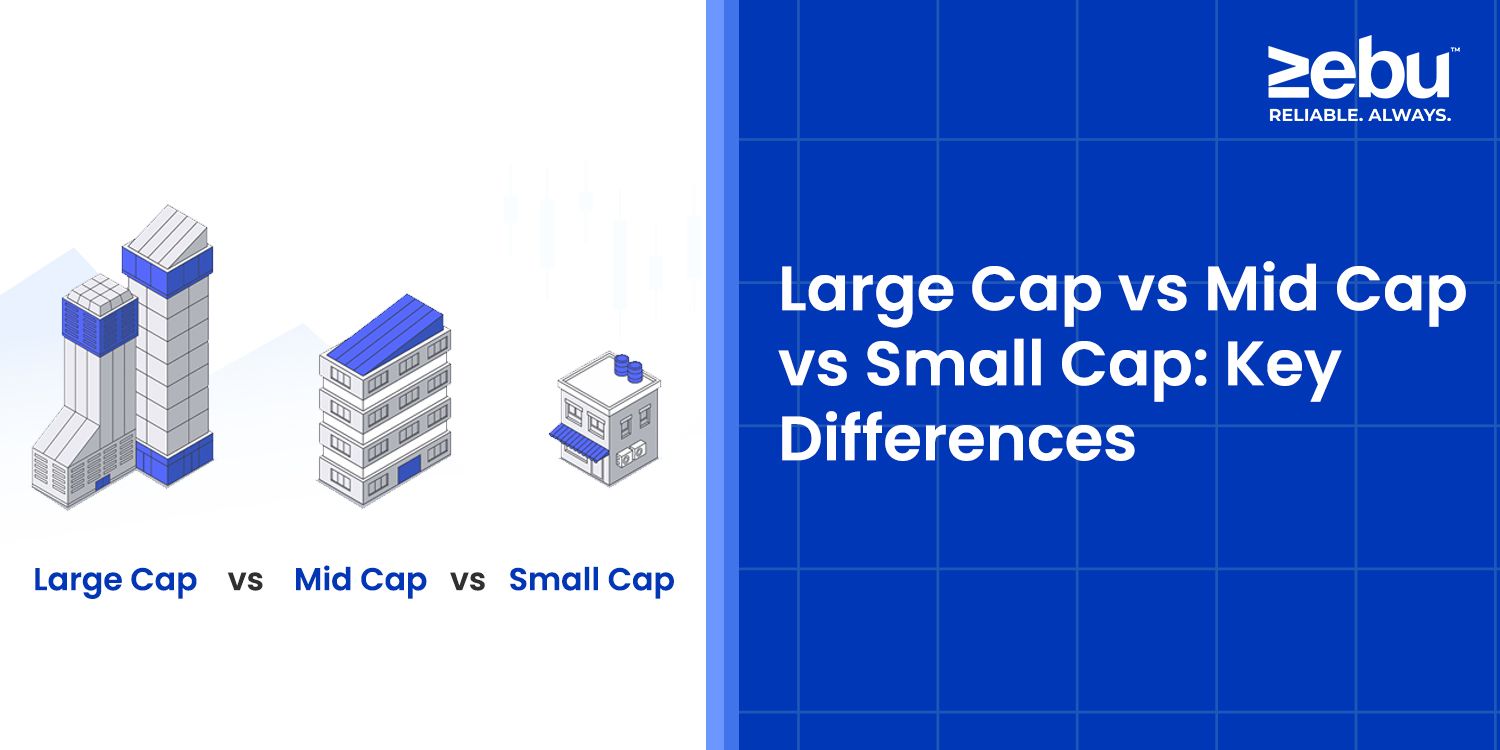
  • Large Cap vs Mid Cap vs Small Cap: Key Differences That Actually Matter

    You don’t need to be an expert to invest in stocks. But knowing a few simple things makes the whole process a lot less confusing. One of those things is understanding what people mean when they talk about large cap, mid cap, and small cap stocks.

    Sounds technical, right? It’s not.

    It’s just about the size of the company — not the number of employees or buildings, but how much the company is worth on the stock market.

    Let’s break this down in the plainest way possible.

    What’s “Cap” Anyway?

    So, “cap” is short for “market capitalization.” That’s a fancy term for a simple idea.

    You take the price of one share. Multiply that by the number of shares the company has out there. That gives you the total market cap.

    If a company has 10 crore shares and each one is ₹100, the market cap is ₹1,000 crore.

    That’s it. No magic. Just basic math.

    Where Do Large, Mid, and Small Come In?

    Now that we know what market cap is, companies are sorted based on how big that number is.

    In India, there’s a general rule based on rankings:

    • Top 100 biggest companies = Large Cap
    • Ranked 101 to 250 = Mid Cap
    • Ranked 251 and below = Small Cap

    It’s not about the business being good or bad. It’s just where they stand in the pecking order.

    Let’s talk about what each one means for you, the investor.

    Large Cap: The Big Guys

    These are the companies most people have heard of. Names like Reliance, TCS, Infosys. They’ve been around for years, if not decades. They’re part of the system.

    When you invest in large caps, you’re usually getting into stable, well-established businesses. They tend to handle economic ups and downs better. They’ve got experience. They’ve got cash. And they’re usually under a lot of watch — media, analysts, regulators.

    Do they grow fast? Not really. That ship sailed years ago. But they can give you slow, steady returns. And sometimes they pay dividends too. You may not double your money in a year, but it’s not a rollercoaster either.

    They’re the kind of stocks you don’t have to watch every day. You can hold them and go about your life.

    Mid Cap: The Ones on Their Way Up

    Mid caps are interesting. They’re not new, but they’re not giants either. Think of them like fast-growing companies that have proven something — but still have room to run.

    These are businesses that might dominate in a specific region or niche. Maybe they’re expanding. Maybe they’re investing in new tech. They’re not done growing, but they’ve survived the early startup chaos.

    With mid caps, you get a mix. More growth potential than large caps. But more risk too. They might spike in good times and fall in a market dip. They’ve got the energy of small caps with a bit more structure.

    For investors who want something between steady and spicy, mid caps make sense. But you still have to pay attention. One bad quarter can hurt.

    Small Cap: The Wild Cards

    Here’s where it gets interesting. Small cap stocks are the smaller, younger companies that most people don’t know about. They’re new to the game, often under the radar.

    These can be game-changers. Or disasters. Or both — depending on when you get in and how long you stay.

    The appeal? They move fast. They can go from ₹20 to ₹200 in a year if something clicks — new product, new market, investor buzz. But the risk is just as real. They can crash just as fast. Sometimes for no clear reason.

    These stocks aren’t always easy to buy or sell. Volumes are lower. Prices swing more. You have to dig deeper, read reports, understand the business. And still, you’re betting on what might happen.

    Small caps are not for the faint-hearted. But they can offer serious upside if you choose well and time it right.

    So Which One Should You Pick?

    That depends. There’s no perfect answer. It’s about what you want from your investments.

    For those seeking stability, approaching retirement, or preferring not to monitor their portfolio frequently, large caps are a safe place to start.

    Those comfortable with some risk and aiming for higher growth than the industry leaders may find mid caps offer that extra edge.

    Younger investors with time on their side, who can handle market swings and are willing to do thorough research, may find small caps exciting—just be sure not to concentrate your entire investment in them.

    Most people do a mix. Some large caps for the base, some mid caps for growth, and a small slice of small caps for that extra pop.

    Can Companies Change Category?

    Absolutely. A small cap that grows steadily can become a mid cap. A mid cap that performs well year after year might get into the large cap club.

    This isn’t fixed. It shifts as companies succeed or struggle. So your portfolio might shift too.

    That’s why some investors check in every six months or so and make changes. Nothing fancy. Just making sure the balance still matches their comfort level.

    A Few Things to Keep in Mind

    1. Market mood matters.
      In bull markets, mid and small caps often shine. In downturns, large caps usually hold better.
    2. Liquidity can be an issue.
      Small caps might not have enough buyers or sellers at the price you want. That can affect your ability to get in or out.
    3. Noise vs. signal.
      There’s a lot of chatter around small and mid caps. Not all of it is useful. Don’t follow hype blindly.
    4. Track your blend.
      You might start with a certain balance between large, mid, and small. But as prices change, that balance shifts. A quick portfolio check every now and then helps.
    5. Don’t overreact.
      Stocks move. Some days will be red. Others green. Look at the business behind the stock, not just the price today.

    Wrapping It Up

    Large cap, mid cap, small cap — they’re just different sizes of companies. And each one plays a different role in your investing story.

    You don’t need to know everything. You just need to know enough to make decisions that feel right for you. What are you comfortable with? What are your goals? How much time do you have?

    This isn’t about picking the perfect stock. It’s about understanding what kind of ride you’re getting on.

    Some people want the expressway. Others don’t mind the bumpy road. The important part is knowing which vehicle you’re in — and where it’s taking you.

    Disclaimer:
    This blog is for informational use only. It does not offer investment advice or recommendations. Investing in the stock market carries risk. Always do your own research or consult a certified financial advisor before making decisions.

  • Fundamental Analysis 101 – 5 Things To Get You Started

    Fundamental analysis is about getting to know a company, its business, and its future plans better. It includes reading and analysing annual reports and financial statements to get a sense of the company’s strengths and weaknesses, as well as its competitors.

    Before you get started on your journey of investments, we believe that you deserve one of the best trading accounts from one of the top brokers in share market. With Zebu, you get access to a state-of-the-art online trading platform with which you can perform comprehensive fundamental and technical analysis.

    A few of the important parameters while doing fundamental analysis are:

    1. Net Profit
    Net profit can mean different things to different people. Net means “after all the deductions.” It’s common to think of net profit as profit after all the operating costs have been taken out, especially the fixed costs or overheads. Gross profit gives investors the difference between sales and direct costs of goods sold before operating costs or overheads are taken into account. This is not the case here. It is also called Profit After Tax (PAT), which is the profit figure that is left after taxes are taken out of the profit.

    2. Profit Margins
    The earnings of a company don’t tell the entire story. Earning more money is good, but if the cost goes up more than the revenue, the profit margin doesn’t get better. The profit margin shows how much money the company makes from each rupee of sales. This measure is very useful when you want to compare businesses in the same industry.
    On the basis of a simple formula:
    Net income / Revenue = Profit margin
    In this case, a higher profit margin means that the company is better able to control its costs than its competitors are. The profit margin is shown in percentages.
    If a company makes 10 paise for every rupee they make, then the profit margin is 10%. This means that the company makes 10 paise for every rupee they make.

    3. Return on Equity Ratio
    Return on Equity (ROE) shows how well a company does at making money. It is a ratio of revenue and profits to the value of the company’s stock. Find out how much profit a company can make with the money its shareholders have put into it. A simple way to do this is to look at the return on equity ratio,

    The Return on Equity Ratio is calculated as shown.

    Return on equity = Net Income / Shareholder’s Equity

    It is calculated in rupees.

    This factor is important because it tells you about a lot of other things, like leverage (debt of the company), revenue, profits and margins, returns to shareholders.

    For example, a company called XYZ Ltd. made a net profit (before dividends) of Rs. 1,00,000. During the year, it paid out dividends of Rs. 10,000. XYZ Ltd. also had 500, Rs.50 par common shares on the market during the year, as well. That’s how the ROE would be calculated then.

    ROE = 1,00,000–10,000/500*50 = Rs. 3.6.

    Simply put, those who own shares in the company will get back Rs. 3.6 for every rupee they invest in the company.

    4. Price to Earnings (P/E) Ratio

    People often use the Price-to-Earnings (P/E) ratio to figure out how much a share of a company is worth. It tells us how much money the company makes per share in the market today.
    We can figure out the Price of earnings, or PE ratio, as shown below.
    In simple terms, PE = Price per Share / Earnings per Share
    This also helps when you want to compare businesses. Then companies should figure out their EPS and then figure out how much their PE ratio value is.
    A high P/E means that the stock is priced high compared to its earnings. Companies with higher P/E seem to be more expensive. However, this measure, as well as other financial ratios, must be compared to other companies in the same industry or to the company’s own P/E history to be useful.
    If company XYZ has a share that costs 50 rupees, and its earnings per share for the year are 10 rupees per share.

    The P/E Ratio is 50/10, which is 5.

    5. Price-to-Book (P/B) Ratio
    A Price-to-Book (P/B) ratio is used to compare a stock’s value on the market to its value on the books. Calculating the P/B ratio is the way to figure out if you’re paying too much for the stock because it shows how much money the company would have leftover if it were to close down today.
    P/BV Ratio = Current Market Price per Share / Book Value per Share
    Book Value per Share = Book Value / Total number of shares
    Having a higher P/B ratio than 1 means that the share price is higher than what the company’s assets would be sold for, which means that the share price is higher. The difference shows what investors think about the future growth of the company.

    XYZ company, for example, has 10,000 shares trading at Rs.10 each. This year, the company recorded a net value of Rs. 50,000 on its balance sheet. The price-to-book ratio of the corporation would be as follows:

    50,000 / 10,000 = Book Value per Share

    P/BV Ratio = 10 / 5

    P/BV Ratio = 2

    The company’s market price is two times its book value. This signifies that the company’s stock is worth twice as much as the balance sheet’s net worth. Also, because investors are ready to pay more for the business’s shares than they are worth, this company would be called overvalued.

    Zebu is the house of the best online trading platform in the country – as one of the top brokers in share market, we have provided the best trading accounts for our users. Think of the most complex analysis that you need to do and Zebull Smart Trader from Zebu will make it possible for you. If you would like to know more, please get in touch with us now.