Tag: technical analysis

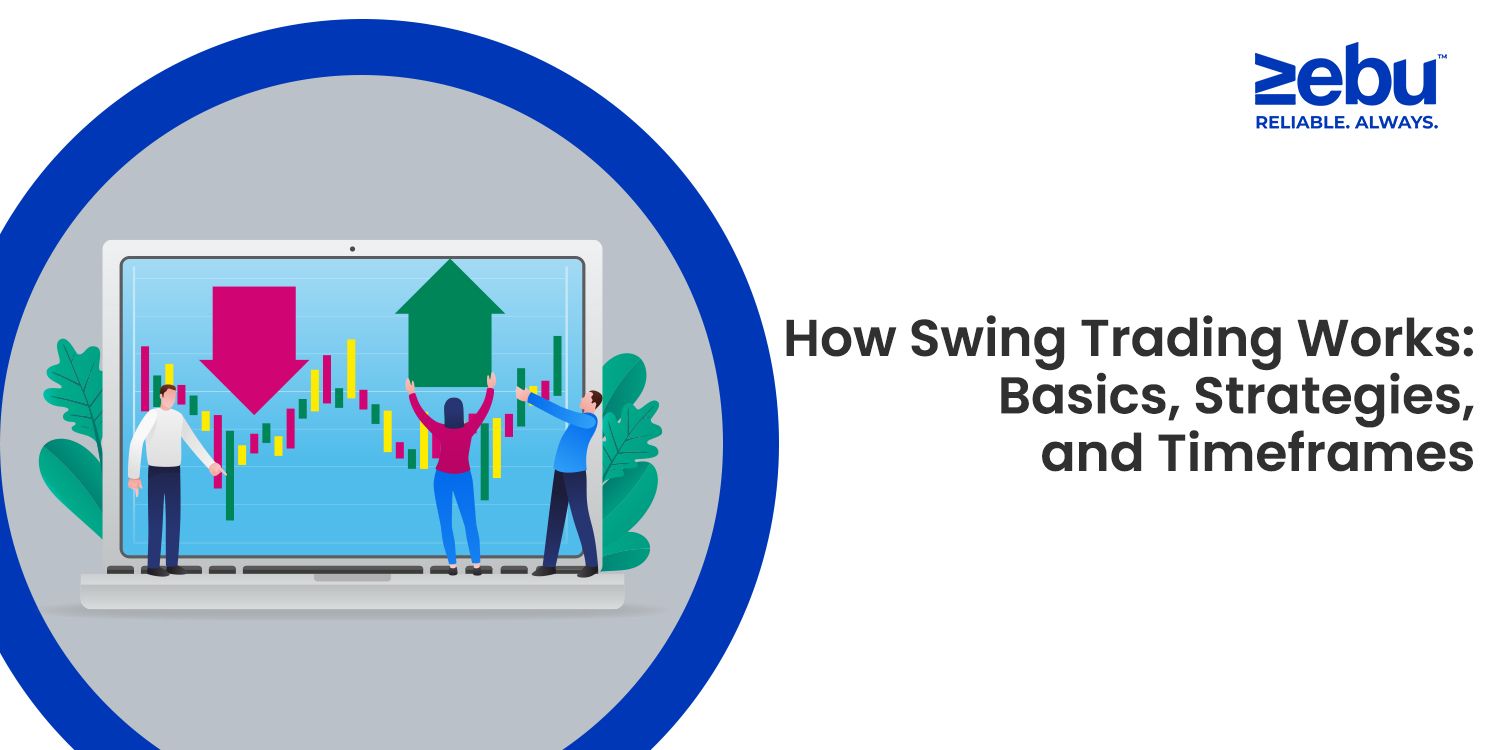
  • How Swing Trading Works: Basics, Strategies, and Timeframes


    You’ve probably heard the term “swing trading” tossed around — maybe in trading groups, on financial news, or while scrolling through your trading app. It sounds active, maybe even aggressive, but in practice, swing trading is more measured than it seems.

    At its core, swing trading is about taking trades that last longer than a day but shorter than a long-term investment. You’re holding a position through a “swing” in price — not chasing quick scalps, but not sitting in for months either.

    For many, it’s a middle ground. It allows time for planning, analysis, and reflection. But it also moves fast enough to keep you engaged and aware.

    What Is Swing Trading, Really?

    The word “swing” is the key. It refers to price movement — up or down — that plays out over a few days or sometimes a couple of weeks. Traders who follow this method aren’t trying to catch the full trend. They just want a section of it. A clean move from a support level to resistance. A bounce. A dip.

    A typical swing trade might last anywhere from two days to two weeks. But that’s not a rule. It’s just the range most people operate in. Some trades wrap up faster. Some take longer. The point is, you’re not trading every tick, and you’re not holding through multiple earnings cycles either.

    What Makes Swing Trading Different?

    The time horizon changes a lot of things.

    First, it changes how you analyze a stock. If you’re day trading, you might stare at 1-minute or 5-minute charts. If you’re investing, you’re reading quarterly reports. For swing trading, most traders focus on daily charts, sometimes zooming into hourly or 4-hour charts to fine-tune entries.

    Second, it changes your pace. Swing trading allows more time to think. You’re not glued to your screen. But you’re also not walking away for weeks. There’s balance. You watch price levels, news, and momentum — but with a little breathing room.

    And finally, it affects how you manage risk. Your stop-losses and targets are wider than in intraday setups. That means you need to size your trades properly. You’re not aiming for 1% moves — you’re usually looking for 5–10%, depending on volatility.

    Common Strategies Swing Traders Use

    Swing trading isn’t random. Most traders stick to a few repeatable setups they trust over time. Here are some of them:

    1. Breakouts
      Breakouts happen when a stock moves above a key resistance level that it struggled to cross earlier. This could be a price the stock hit several times before pulling back. When it finally breaks above with strong volume, it often signals momentum. Swing traders may enter right after the breakout and ride that momentum for a few days.
    2. Pullbacks
      When a stock makes a strong move — either up or down — it rarely goes in a straight line. There’s usually a pause, or a step back. That step back is what traders call a pullback.

    It’s not a reversal. It’s more like the market catching its breath. Maybe the stock rallied hard, then slips a bit over a few sessions. If the trend is still intact, that drop can be an opportunity — a spot to enter the trade at a better price.

    Swing traders often watch for these dips near areas like moving averages or previous support levels. If the price pulls back, slows down, and starts to show signs of turning back in the original direction, that’s where many step in. The goal isn’t to predict the bounce perfectly — just to catch a cleaner entry with less risk.

    1. Reversals
      Reversals are a different story. Here, you’re not looking for the trend to continue — you’re watching for signs that it might be over.

    Maybe the stock has been climbing steadily for weeks, but it starts to slow down near a resistance level. Or there’s a sharp move up followed by heavy selling on volume. Reversal trades often show up at the edge of big moves — the turning point where buyers become sellers or vice versa.

    Since this means trading against the most recent direction, it usually takes more confirmation — you want to see the shift actually happening, not just guess that it might.

    1. Range Trading
      Sometimes, the market doesn’t trend at all. Some stocks just move back and forth in a zone — up a few points, down a few points, again and again.

    If you can spot a clear range, that can be just as tradable. You might look to buy near the lower boundary and sell near the upper end. This kind of trading works best when the stock isn’t reacting to news or breaking out — just moving steadily between familiar levels.

    It takes patience to trade a range. And discipline. You have to accept that you’re not looking for a big breakout — just steady, controlled moves within the lines.

    How Do You Pick Stocks for Swing Trading?

    Not every stock makes sense for swing trades. You’re looking for ones that have direction — but also structure. Something you can read.

    That might mean a recent breakout, a clean pullback to support, or even a reversal off a known level. You want price action that isn’t messy. You want volume. You want behavior that gives you room to plan.

    The goal isn’t to find the busiest stock — it’s to find the one that moves in a way you understand.

    The Role of Timeframes

    Timeframes are flexible in swing trading, but the most common chart used is the daily chart. It gives you enough context without overwhelming you with noise. If the daily setup looks solid, traders might zoom into 4-hour or 1-hour charts to find precise entries.

    However, timeframes aren’t rules. They’re tools. Some traders swing trade based on weekly setups. Others check 15-minute charts for entries. It depends on your approach and how often you monitor your trades.

    What matters is consistency. You pick a system, and you stick to it long enough to see results.

    Risk Management: A Quiet but Crucial Piece

    No swing trading strategy works without proper risk control.

    The most common tool is a stop-loss — a price level where you exit if the trade goes against you. It protects you from bigger losses and keeps emotions in check. Without one, a small red day can turn into a frustrating hold.

    Traders also use target levels to take profits. Some scale out — taking partial profits along the way — while others exit all at once when the target is hit.

    Trailing stop-losses are also used sometimes. These move up as the price rises, helping you lock in gains while giving the trade room to run.

    Risk management isn’t exciting. But it’s the difference between surviving a bad trade and letting one mistake ruin your month.

    Swing Trading on a Platform Like Zebu’s MYNT

    The experience of swing trading also depends on the tools you use.

    A platform like MYNT by Zebu gives access to real-time charts, technical indicators, and clear order types — so you can plan your entries and exits smoothly. Whether you’re using a limit order to control your entry price or a stop-loss to manage risk, MYNT helps with execution

    You also get transparency — live price feeds, order book depth, and account views that let you monitor your trades without second-guessing.

    For swing traders, this kind of clarity is key. You’re not staring at screens all day. You’re checking levels, watching setups, and stepping in with a plan.

    Is Swing Trading for You?

    That’s a personal question. It depends on your time, personality, and goals.

    If you enjoy analysis, want some breathing room, and prefer holding trades for a few days rather than hours or months — swing trading offers that balance. You’re still active. You still make decisions every week. But you’re not reacting to every price tick.

    On the flip side, swing trading requires patience. It means holding through small fluctuations. It means watching a trade sit flat for days before moving. And sometimes, it means missing the move entirely.

    But for many, that in-between zone — not too fast, not too slow — is where trading starts to feel sustainable.

    Final Thoughts

    Swing trading isn’t about catching the exact top or bottom. It’s about understanding structure, planning well, and executing with discipline.

    You’re not chasing. You’re not sitting idle. You’re stepping in when the setup makes sense, and you’re stepping out when the move is done.

    That kind of rhythm takes time to build. But once it clicks, you stop guessing — and start trading with more clarity.

    Disclaimer:
    This article is for educational purposes only and does not offer financial advice. Trading involves risk. Always consult a qualified financial advisor before making investment decisions. Zebu Share and Wealth Management Pvt. Ltd. makes no guarantees regarding the outcomes of any strategy discussed.

    1. Which timeframe is best for swing trade?

      Swing trading works best on daily or weekly charts, giving you time to catch trends without the stress of minute-by-minute monitoring.

    2. What are the most common swing trading strategies?

      Popular strategies include trend following, breakout trading, and pullback trading, often applied to swing trading stocks with good liquidity.

    3. Is swing trading riskier than intraday trading?

      Not necessarily. Swing trading strategies spread trades over days, reducing the pressure of intraday moves, though market swings still carry risk.

    4. Is swing trading a good option for beginners?

      Yes, swing trading for beginners can be easier to manage than intraday trading because it allows more time for analysis and decision-making.

    5. What is the 2% rule in swing trading?

      The 2% rule suggests you shouldn’t risk more than 2% of your capital on a single trade, helping manage losses and protect your portfolio.

  • How SIP Investors Can Use Support & Resistance Zones to Build Confidence

    SIP investing is supposed to be simple. You pick a good fund or stock, set a monthly amount, and automate the rest. No emotions. No overthinking. Just consistency.


    But even the most disciplined SIP investors check their holdings once in a while—and wonder:
    “Did I just buy at the top again?”
    “Should I pause and wait for a dip?”
    “Is this stock really at a good level?”

    That’s where a basic understanding of support and resistance comes in—not to time the market, but to feel more in rhythm with it. At Zebu, we’ve seen more SIP users start to explore charts—not to become traders, but to make peace with volatility. And in that process, support and resistance zones have become quietly useful.


    What Are Support and Resistance Zones—Really?

    Forget the technical definitions for a moment. Here’s the simple version:

    • Support is a level where a stock or index tends to stop falling. It’s where buyers feel the price is “worth it.”
    • Resistance is a level where it tends to stop rising. It’s where sellers often step in.

    Think of support as a floor, and resistance as a ceiling. Prices may bounce off them or break through—but they often matter because many people think they matter.

    They’re not fixed lines. They’re zones. And they’re not predictions. They’re just reference points.


    Why Should SIP Investors Care?

    If you’re investing regularly—monthly, quarterly, or even annually—knowing where support and resistance zones lie can help you:

    Stay calm when prices dip near known support
    Avoid chasing stocks that are right at long-term resistance
    Choose better entry points when you manually top up
    Understand if recent performance is part of a pattern—or a potential shift


    Again, this isn’t about stopping your SIP every time a resistance is near. It’s about context.


    A Practical Example

    Let’s say you’re doing a SIP into a quality mid-cap stock—say, ABC Industries.

    You notice the stock has bounced from ₹720–740 three times in the last six months. That’s a support zone.

    On the upside, every time it hits ₹840–860, it pulls back. That’s a resistance zone.

    Now imagine your SIP executes at ₹850. It’s still okay—you’re building long-term. But knowing this zone exists might help you:

    • Manually top up if it dips again near ₹740
    • Pause optional additions if it runs ahead of earnings and hits ₹860
    • Stay patient if it dips post-purchase, because you expected that zone to attract buyers

    This isn’t prediction. It’s preparation.

    What the Market Is Doing Right Now

    In July 2025, Nifty is trading around 23,400, while Sensex hovers above 77,000. We’ve seen:

    • Recent support near 22,900 on Nift
    • Resistance around 23,500–23,600
    • PSU banks and capital goods showing relative strength
    • FMCG stocks pausing after strong runs

    If you’re SIP-ing into index ETFs or sector-specific funds, this information gives you a map—not a rulebook.

    For instance, a PSU-focused SIP may ride short-term momentum. An FMCG-focused one may cool temporarily. But support zones below recent dips suggest buyers remain active.

    Using Support & Resistance Without Overthinking

    You don’t need to spend hours on charts. Here’s a simple routine:

    1. Log into Zebu → Check the stock or index you’re investing in
    2. Use basic chart view → Select 6-month or 1-year timeframe
    3. Look for clusters → Price zones where moves repeatedly slow, reverse, or gather volume
    4. Set alerts → Use Zebu tools to notify you when your asset nears those zones

    Then forget it until you need it.

    These zones aren’t guarantees. But they help filter noise. Instead of reacting to a 3% drop, you’ll think, “Ah, back near support.” That mindset shift matters.

    Common Questions We Hear

    Q: Should I stop my SIP near resistance?
    Not necessarily. But you might choose to pause optional top-ups or diversify new funds elsewhere.

    Q: What if support fails?
    That happens. It doesn’t mean your SIP was wrong. But it might prompt a deeper look at why the stock or fund broke structure—news, results, sentiment.

    Q: Can I do this without charts?
    Basic support/resistance data is built into many Zebu screens. You don’t need to draw anything. Just glance.

    Where This Really Helps: Emotional Control

    The real benefit of using support and resistance as an SIP investor is not better timing. It’s less panic.

    • You’ll stop feeling like every market dip is a mistake
    • You’ll stop buying out of FOMO at resistance.
    • You’ll ride volatility with context.

    We’ve seen this play out across Zebu’s delivery-based users. The ones who use charts—not obsessively, but observationally—tend to hold better, longer, and with more confidence.

    Zebu Tools That Help You Do This Quietly

    Our platform supports non-intrusive investing. That means:

    • Chart views that aren’t cluttered with signals
    • Alerts tied to price levels—not just price change
    • Watchlist summaries that show bounce zones and momentum levels
    • Delivery snapshots that help you track entry points over time

    Because most SIP investors don’t want noise. They want a calm check-in now and then—enough to feel grounded.

    Final Thought

    Support and resistance zones won’t change your financial goals. But they might help you stay with them longer. If your SIP is into something solid, short-term movements shouldn’t throw you. But knowing where the price has historically turned can anchor your confidence—and make you feel less like you’re flying blind.

    At Zebu, we don’t want every investor to become a chart reader. We just want every investor to feel like they can see what matters. Because investing, when it’s done quietly and consistently, shouldn’t feel confusing. It should feel yours.

    Disclaimer

    This article is meant for educational purposes only and does not constitute investment advice or financial recommendations. Support and resistance zones are based on historical data and do not guarantee future performance. Zebu encourages users to consult with a certified advisor before making investment decisions based on technical indicators or personal interpretations.

    FAQs

    1. How can SIP investors use support and resistance?

      Support and resistance in stock market help SIP investors identify price zones where stocks are likely to bounce or face selling pressure, aiding better timing decisions.

    2. When to buy using support and resistance?

      Buying near strong support levels and avoiding purchases near resistance in stock market can improve entry points and reduce risk.

    3. Do support and resistance work for long-term SIP investments?

      Yes, resistance level in stock market can guide SIP investors on when to adjust allocations or pause contributions, complementing long-term goals.

    4. What tools can SIP investors use to find support and resistance?

      Charts, moving averages, and trend lines are common tools to spot support and resistance zones effectively.

    5. Can support and resistance help improve SIP returns?

      Yes, using these zones can improve timing decisions, helping SIP investors optimize returns over the long term.

  • Why Even Long-Term Investors Should Glance at Technical Charts Amid Geopolitical Swings

    Markets move for many reasons—earnings reports, global signals, elections, tariffs, and sometimes just… mood. Lately, that mood hasn’t been predictable. One day, headlines from West Asia rattle indices. Another, an index reshuffle quietly redirects flows. But whatever the cause, the result looks the same on your screen—red, green, hesitation.

    Now, for most long-term investors in India, the instinct during such swings is to hold steady. Stay the course. Ignore the noise.

    That instinct isn’t wrong. But it’s incomplete.
    Because what often gets overlooked—especially by those focused purely on fundamentals—is the quiet value of context. And that context, more often than not, shows up in the charts. Not as a signal to buy. Not as a tip to sell. But as a way to see where you are before you decide where to go.

    When Prices Move but Nothing Else Has Changed
    Let’s say you’ve held a stock for a year. Fundamentally, nothing has changed. The company’s still making money. The business model still makes sense. Yet, the stock falls 6% in two days. If you’re like most long-horizon investors, the first instinct is to dismiss it: “This isn’t for me. I’m not trading.” Fair. But do you check why it fell?

    Sometimes the answer isn’t in the earnings reports or news feeds. It’s on the chart.

    Not in some exotic pattern or obscure indicator. Just in the simple structure—where the price was, how it moved, and whether this dip is really new or just a revisit to where it’s been before. Long-term investors aren’t chasing signals. But they do benefit from recognizing patterns. Even if it’s just to stop themselves from reacting emotionally.

    Not All Red Days Are Created Equal
    This past week, market indices dipped sharply. On the surface, it looked like panic. But underneath, it was part reshuffle (stocks entering and exiting Sensex/Nifty), part global unrest, and part positioning. Now if you’re holding stocks in passive funds or direct equities, you might have seen red. But the story was more nuanced. Charts showed something interesting. Key supports weren’t broken. Volume didn’t spike abnormally. Prices dipped, yes—but without the technical panic that usually suggests something deeper.

    If you saw the chart, you’d breathe a little easier. If you didn’t, you might’ve assumed the worst. That’s where technical analysis, even in its simplest form, earns a place—not to act, but to understand.

    Entry Isn’t Everything. But It Still Matters.
    One misconception is that timing only matters to traders. That as long as you believe in a stock, it doesn’t matter when you enter.
    That’s not quite true.

    If you’re buying a stock that’s trending down on steady volume, you might be catching a falling knife. If you’re buying when the price is consolidating at a support level, you might be giving yourself breathing room. That doesn’t make you a trader. That makes you deliberate.

    Platforms like Zebu now make these tools available with minimal friction. You don’t have to open a new app or download a plug-in. The chart is just there, next to the fundamentals tab. No noise. Just a little bit of structure in a chaotic space.
    What Can a Chart Really Tell You?
    Here’s what you don’t need:

    You don’t need to know what RSI divergence is.
    You don’t need to draw Fibonacci arcs or recognize cup-and-handle formations.
    Here’s what you can do with basic chart awareness:
    See if a stock is consistently making higher highs or lower lows
    Notice if recent dips are on heavy or light volume.
    Check whether the price is near a commonly watched average like the 200-day line.

    That’s it. And that’s often enough.

    Glancing ≠ Trading
    This part matters. Glancing at charts doesn’t turn you into a trader. It doesn’t mean you’re abandoning fundamentals. It doesn’t mean you’re reacting to every tick. It means you’re willing to observe. Because sometimes the chart shows that a fall was expected. That the price is simply revisiting its prior level. And that gives you calm. Not conviction. Not certainty. Just clarity. You still stay the course. You just understand the terrain a little better while you walk it.

    Case in Point: Passive Investors, Active Minds
    Even index investors are affected by these swings.

    Take the recent Sensex reshuffle. Passive funds had to adjust. Stocks like Trent and BEL saw inflows. Others saw outflows. If you were watching only fundamentals, it looked random. But the chart showed otherwise. Momentum had been building.

    The addition to the index was a trigger—but not the start.
    A glance at the chart would’ve told you the story had been unfolding long before the headlines caught up.
    The Mobile Factor: Charting at Arm’s Reach
    If you’re using a mobile trading platform, you already know how easy it is to check a chart. It takes five seconds. Two taps. And most platforms (Zebu included) let you change timeframes, add a moving average, and check basic volume—all without leaving the screen. This isn’t power-user behavior anymore. It’s baseline awareness.

    And the fact that so many investors are doing this quietly—from Kochi to Kanpur—without making noise about it, tells you something. That the lines between “fundamental” and “technical” aren’t as sharp as they once were. They’re merging. Not because of theory. But because of need.

    What Not to Do
    Here’s what this blog isn’t saying: Don’t try to time every buy or sell based on lines and candles. Don’t abandon your long-term view because a support broke. Don’t get drawn into signal-chasing because someone on Twitter posted a breakout alert.

    The goal isn’t reaction. It’s recognition. The chart is a mirror, not a map. You can look into it. But you don’t have to walk in the direction it points.

    Some Days, a Glance Is Enough
    Sometimes, you just want to know: “Is this panic, or is this pattern?” You’re not going to act today. You just want to know whether you’re walking into a room with the lights on or off.

    A chart can’t tell you the future. But it can tell you what happened. And in a world where headlines twist fast and numbers feel noisy, that retrospective view is underrated. It won’t make you rich. But it might make you calmer. And if you’re playing the long game, calm might be your most valuable asset.

    Disclaimer
    This article is intended for informational purposes only. It is not financial advice or a recommendation to trade. Zebu does not guarantee investment outcomes or returns. All decisions related to stock trading and investing should be made based on individual goals and after consultation with a certified financial advisor.

    FAQs

    1. Is technical analysis needed for long-term investment?

      Yes, technical analysis for long term investors helps identify trends, entry points, and potential risks, even for portfolios held over years.

    2. Can technical analysis predict market moves during geopolitical tensions?

      While it can’t predict exact moves, combining charts with insights on geopolitical events and stock market trends helps investors anticipate potential volatility.

    3. How do geopolitical events affect investing?

      Geopolitical events can impact stock prices, sectors, and investor sentiment, making markets more unpredictable in the short term.

    4. Should I hold or sell stocks during geopolitical uncertainty?

      Decisions should be based on fundamentals, risk tolerance, and long-term goals rather than short-term panic.

    5. Can charts predict market crashes during global conflicts?

      Charts may signal trends or warnings, but no tool can perfectly predict crashes—technical indicators for long term investment are best used to manage risk.

  • Why Technical Analysis Isn’t Just for Traders—And How Long-Term Investors Are Quietly Using It Too

    There’s this idea that floats around every new investor community—that technical analysis is only for the fast-money folks. You know, the intraday crowd. Candles, charts, scalp trades, the works.

    But that’s not entirely true. And maybe it never was. Because what’s happened, quietly, is that a lot of long-term investors—not the ones yelling “buy the dip” on social media, but the quieter kind—have started borrowing from the trader’s toolkit. Not to trade more. But to see better.

    And honestly? It makes sense.

    What Even Is “Technical” Anyway?

    At its core, technical analysis is just the study of price and volume. Not what a company says. Not what the economy’s doing. Just how the stock has moved. Where it paused. Where it collapsed. Where people seemed to care—and where they didn’t.

    Some folks turn that into a full-time system. Patterns, indicators, backtests. But you don’t have to go that far to get value. Sometimes, all it takes is pulling up a one-year chart and asking: Did this stock make higher highs or lower lows? That’s not trading. That’s observation.

    The Long View Still Has Patterns

    Say you’re thinking of holding a stock for the next three years. Cool. But when are you entering? Random day? Or when the price’s finally stopped falling after months of drift? Some folks time their entries based on analyst reports. Others look for “support zones.” You’d be surprised how often those zones appear on basic charts—even for blue-chip companies.

    It’s not about catching the bottom. It’s about avoiding entries where the floor’s still collapsing.

    That’s where technicals help.

    Investors Use Fundamentals. But They Don’t Live Inside Them.

    Even the most patient, valuation-focused investor isn’t staring at balance sheets every week. Once you’ve done the math, what you’re watching is behavior. Does the market agree with your thesis? Is volume picking up? Did something change?

    That’s chart-watching.

    Maybe not with Bollinger Bands or MACD. But with intent.

    Zebu’s platform, for instance, doesn’t force traders to choose. You can check earnings, then flip to a 3-month chart. It’s fluid. Not segmented. That blending—that’s how modern investing looks now.

    Avoiding Painful Timing

    Let’s be honest. Some investors get the company right, but the price wrong. They buy too early. Or just before a correction. And sometimes, all they needed to do was zoom out.

    • “Was this stock in an uptrend?”
    • “Did it just break below its 200-day average?”
    • “Was there a sudden spike in volume on a red candle?”

    None of that requires being a trader. Just curiosity.

    Tools Aren’t Just for Trades

    You don’t need to draw trendlines or scalp intraday to use RSI. Or moving averages. Even the most conservative investors use basic technical indicators to confirm if the market’s in sync with the company’s story.

    It’s like checking weather before a road trip. You’re still making the journey. You’re just smarter about when you leave.

    The Psychology Side No One Talks About

    One reason long-term investors started checking charts? To keep their own heads calm.

    When a stock drops 5% in a day, it’s easy to panic. But a glance at a chart might show you it’s just revisiting a previous support. Or still within a larger trend. That single visual—red candles stacked but staying above a known level—can be more calming than re-reading the last five annual reports.

    Nobody’s Asking You to Become a Day Trader

    This isn’t about switching styles. It’s about seeing more. If you use SIP calculators, you already use tools. This is just one more. Charting tools don’t tell you what to do. But they can help you frame better questions. Like: “Has this level ever held before?” Or: “Is this rally happening on volume, or just air?”

    Simple stuff. But helpful.

    Even Mutual Funds Use Charts

    This part might surprise you. But even large institutional funds—those big, buttoned-up ones—watch technical indicators before making huge allocations. Not always for timing. But for reading sentiment. Because if a fundamentally great stock is sliding below key levels on high volume? That says something. Doesn’t matter what the PE ratio looks like.

    If You’re on Mobile, It’s Even Easier

    On Zebu’s mobile platform (or any serious one, really), the shift between reading a news headline and looking at a daily chart is one swipe. You don’t need to open ten tabs. Just check.

    That kind of frictionless movement—that’s how technical analysis stops being intimidating. It starts becoming… normal.

    Final Thought: It’s Just One More Lens

    Fundamentals tell you what a company is. Technicals tell you how the market’s treating it. You don’t need to marry either. But it’s probably wise to date both. Because the modern investor? They’re not just buying a stock. They’re buying time. And tools help them spend that time better.

    Disclaimer

    This article is intended for educational purposes only. It is not investment advice or a trading recommendation. Zebu offers access to tools and information to support user decisions, but individual outcomes may vary. Please consult a licensed financial advisor before making financial decisions based on market data or chart analysis.

    FAQs

    1. Is technical analysis only for day traders?

      No, technical analysis for long term investors can help spot trends, entry points, and potential risks even for multi-year investments.

    2. Can you use technical analysis for long-term investing?

      Yes, technical indicators for long term investment, like moving averages and trend lines, can guide long-term buy and sell decisions alongside fundamentals.

    3. How does technical analysis differ from fundamental analysis?

      Technical analysis focuses on price patterns and market behavior, while fundamental analysis looks at company financials, growth, and intrinsic value.

    4. Does technical analysis work for long-term investing?

      It does, especially when used in combination with fundamental analysis to time investments and reduce risk over time.

    5. Which technical indicators are best for long-term investors?

      Moving averages, MACD, and RSI are popular for long-term trends, helping investors confirm market direction and avoid poor timing.

  • Are Charting Tools Really Helping You or Just Distracting You?

    Spend any time in the world of trading and you’ll quickly be introduced to an overwhelming number of charts, graphs, and technical indicators. The colorful candlesticks, moving averages, and oscillators give you the sense that you’re operating with precision—that if you just find the right pattern, success is inevitable.

    But for many retail traders, especially those just getting started, charting tools can become less of a guide and more of a trap. So how do you know if they’re actually helping you trade smarter—or if they’re simply distracting you from what matters?

    Let’s explore this question from the perspective of a trader who wants to improve—not impress.

    Charting 101: What You’re Actually Looking At

    Let’s start by making one thing clear: charting is not the problem. Good charting platforms—Zebu includes one powered by TradingView, for example—can offer incredibly useful insights.

    A basic chart shows you the price movement of a stock over time. Candlesticks show open, close, high, and low prices. You can overlay technical indicators like:

    • Moving Averages (MA)
    • Relative Strength Index (RSI)
    • Bollinger Bands
    • MACD (Moving Average Convergence Divergence)
    • Volume

    These tools attempt to show you whether a stock is trending, reversing, or losing momentum. They give clues, not guarantees.

    Used well, they give structure to what would otherwise be guesswork.

    Where It Starts Going Sideways

    The trouble begins when you go from a few indicators to… all of them. You start with RSI. Then you add MACD. Then Fibonacci retracement levels. Then Ichimoku clouds. Before you know it, your chart looks like a complicated cockpit. You’re no longer seeing price—you’re seeing confusion.

    This is known as “analysis paralysis.” Too many signals, and you don’t know which one to trust. You hesitate. You overthink. And in trading, that usually means missed opportunities—or worse, bad decisions.

    The Illusion of Precision

    Here’s the trap: a complex chart feels smarter.

    You look at it and think, “Now I’m seeing what the professionals see.” But more often than not, the chart is just reflecting what the stock already did—not what it will do.

    Indicators lag. They are based on past price movement. They confirm, not predict.

    A stock can still break a key resistance level for no reason you can see on a chart. A company’s earnings surprise can make a perfectly set up pattern irrelevant in seconds. That doesn’t mean charts are useless. But it does mean they aren’t the crystal balls they’re often sold as.

    Ask: What’s the Question You’re Trying to Answer?

    Before opening a chart, ask yourself: what am I trying to figure out?

    • Am I looking for a trend?
    • Am I waiting for a breakout?
    • Am I spotting a reversal?

    Each of these has a few specific tools that help. That’s it. You don’t need five indicators to answer one question.

    For example:

    • For trend confirmation? A moving average or two.
    • For momentum? RSI and MACD.
    • For volatility? Bollinger Bands.
    • For volume confirmation? Plain volume bars.

    Keep it lean. Let the chart serve the question—not the other way around.

    Who’s Actually Using the Tool—You or Your Emotions?

    It’s easy to convince yourself that you’re doing “technical analysis” when really you’re just scrolling through charts until one makes you feel good about your bias. You bought a stock. Now you’re scanning for indicators that justify holding. Or you missed a trade and are searching for “proof” that it wasn’t a good setup anyway.

    This is a very human impulse—but it’s not analysis. It’s emotional cushioning.

    The right way to use a charting tool is before the trade, when your thinking is clear. Not afterward, when you’re defending a position.

    Chart Literacy > Chart Obsession

    What separates the casual chart-watcher from the skilled trader is the ability to read price action, not just apply layers of tools. If you can look at a basic candlestick chart and understand:

    • What buyers and sellers are doing
    • Where momentum shifted
    • How strong the breakout or breakdown is

    …then you’re already ahead of most traders.

    Indicators are meant to support your read—not replace it. And no matter how advanced a chart looks, it still needs context. News events, earnings reports, sector movements—these aren’t on the chart, but they matter.

    Are You Spending More Time Charting or Trading?

    Here’s a quick gut check: if you spend 80% of your time adjusting chart settings and only 20% making decisions, something’s off. Trading is a decision-making sport. Charts are a planning tool. The goal isn’t to design the most visually complex chart. The goal is to make clear, consistent choices.

    Many experienced traders set their charts once and rarely change them. Why? Because they’ve figured out which tools give them clarity—and they stick to those.

    Try that approach. Pick 2–3 indicators that make sense for your style. Test them. Tune them. Then leave them alone.

    Mobile Charting: Convenient, But Still Requires Clarity

    Apps like Zebu’s now offer full mobile charting, including advanced indicators and drawing tools. This is a huge shift from a few years ago, where you had to use a desktop.

    But just because it’s easy to chart on your phone doesn’t mean you should chart all the time.

    Set alerts instead. If a stock crosses a level you care about, let the app tell you. Don’t sit there refreshing RSI every 5 minutes.

    Tools are there to reduce emotional friction—not amplify it.

    So… Are Charting Tools Worth It?

    Yes—if:

    • You know what you’re looking fo
    • You’ve learned the logic behind each tool you use
    • You apply them consistently across trades
    • You’ve seen them work for your style and temperament

    No—if:

    • You’re using them to justify impulsive trades
    • You switch tools every week
    • You feel overwhelmed more than informed
    • You spend more time in the tool than using its output

    A chart is a map. But even the best map is useless if you don’t know where you’re trying to go.

    Final Thought: Tools Don’t Make You a Trader—Process Does

    It’s tempting to think that more screens, more indicators, and more chart overlays will turn you into a sharper, faster trader. But the truth is, trading success is mostly boring.

    It’s about discipline. Repetition. Structure. Thoughtful risk. Charting tools can absolutely be a part of that. But only if they fit your process. Not someone else’s. Not some YouTube strategy with 10 moving parts.

    Just yours. So the next time you stare at a screen full of lines, candles, bands, and colors—pause. Ask what you’re really trying to see. Then remove what you don’t need.

    Because often, trading clarity comes not from adding more—but from removing the noise.

    Disclaimer

    This blog is meant to provide general information and reflect broad market observations. It doesn’t take into account your specific financial situation or investment needs. Zebu shares this for educational purposes only and doesn’t promise returns or make personal recommendations. Before you act on anything here, it’s always a good idea to talk to a qualified financial advisor.

  • This could be your HOLY GRAIL of TRADING STRATEGY

    Good day! If you’re new to the stock market, you might have heard about the pursuit of the “holy grail” market strategy, a mythical investment method that ensures earnings and outperforms the market. The reality is that there is no such plan, which is unfortunate.

    This is why:

    No matter how much expertise or information a person has, they will never be able to predict the stock market with absolute certainty. There are simply too many factors at play, including, among others, current world events, interest rates, and modifications to industry rules. Due to unforeseeable occurrences that have an effect on the market, even the most experienced buyers occasionally suffer unanticipated losses.

    Every strategy has advantages and disadvantages: Each business strategy has a distinct collection of advantages and disadvantages. For instance, while some investors may concentrate on value investing, which entails buying stocks that are thought to be undervalued, others may favour growth investing, which entails making investments in businesses that are predicted to experience fast future development. Finding a plan that matches your financial objectives and risk tolerance is crucial.

    Future outcomes cannot be predicted by past performance, which is an essential consideration when choosing assets. However, it’s important to keep in mind that past performance does not ensure future success. Many investors make the error of buying into stocks that have recently done well in an effort to replicate prior performance, only to discover that these stocks don’t continue to perform as predicted.

    Investing entails danger: Every transaction carries a certain amount of risk. Even the most risk-averse financial plans, like putting money in savings accounts or government bonds, carry some degree of risk. When making stock market purchases, it’s crucial to recognise and control your risk tolerance, spread your holdings, and keep the long term in mind.

    Because there is no secret formula that ensures success in the stock market, the quest for the “holy grail” market plan is fruitless. Focus on creating a diversified investment portfolio that is in line with your objectives and risk tolerance rather than trying to find a singular strategy that performs well in all market circumstances. Remember, investing in the stock market takes perseverance, focus, and a long-term outlook.

  • The Theory Behind Fibonacci Retracement Trading Strategy

    Fibonacci retracement trading strategy is a technical analysis tool that is widely used by traders to identify potential levels of support and resistance in a financial market. This strategy is based on the mathematical sequence developed by Leonardo Fibonacci in the 13th century and the idea that markets move in predictable trends. In this blog post, we will explore the theory behind Fibonacci retracement trading strategy and how it can be used to make informed trading decisions.

    The Fibonacci sequence is a series of numbers where each number is the sum of the two preceding numbers. The sequence starts with 0, 1, and continues as 0, 1, 1, 2, 3, 5, 8, 13, 21, 34, 55, 89, 144, and so on. The Fibonacci retracement levels are calculated by dividing the vertical distance between a high and low point by the key Fibonacci ratios of 23.6%, 38.2%, 50%, 61.8%, and 100%.

    In the context of trading, Fibonacci retracement levels are used to identify potential levels of support and resistance in a financial market. When the market moves in a particular direction, traders use the Fibonacci retracement levels to determine where the market is likely to experience resistance or support. For example, if the market is in an uptrend, traders might look for opportunities to buy at the 38.2% or 50% retracement levels, which are considered to be potential support levels. If the market is in a downtrend, traders might look for opportunities to sell at the 61.8% retracement level, which is considered to be a potential resistance level.

    The theory behind Fibonacci retracement trading strategy is that market trends often retrace a predictable portion of a move, after which they continue to move in the original direction. This is where the key Fibonacci ratios come into play. Traders believe that these ratios are significant because they are found in many natural phenomena and are thought to reflect the underlying structure of the financial markets.

    One of the key benefits of using the Fibonacci retracement trading strategy is that it can help traders identify potential levels of support and resistance in the market. This information can be used to make informed trading decisions, such as entering or exiting a trade, adjusting stop-loss orders, or placing take-profit orders.

    Another benefit of using the Fibonacci retracement trading strategy is that it can be used in conjunction with other technical analysis tools, such as trend lines, candlestick patterns, and moving averages. This can help traders confirm their trades and increase the accuracy of their predictions.

    In conclusion, the Fibonacci retracement trading strategy is a powerful tool that can be used by traders to identify potential levels of support and resistance in the financial markets. By combining the theory of the Fibonacci sequence with the concept of market retracements, traders can make informed trading decisions and achieve their financial goals. However, it is important to remember that no trading strategy is foolproof and traders should always conduct their own research and seek advice from a financial advisor before making any investment decisions.

  • Swing Trading in a Volatile Market: How to Navigate the Uncertainty

    Swing trading is a popular investment strategy that involves holding a stock or other security for a short period of time, usually a few days to a few weeks, in the hopes of profiting from short-term price movements. However, when markets are volatile, it can be difficult to navigate the uncertainty and make informed trading decisions. In this blog post, we will discuss strategies for swing trading in a volatile market.

    Use technical analysis
    Technical analysis is the study of past market data to identify patterns and trends that can be used to make trading decisions. It is an essential tool for swing traders, as it can help you identify entry and exit points, as well as potential areas of support and resistance. In a volatile market, it is important to pay attention to indicators such as moving averages, relative strength index (RSI), and Bollinger Bands, which can help you identify potential trend changes.

    Keep an eye on the news
    In a volatile market, keeping an eye on the news is especially important. Economic news, such as interest rate decisions and GDP reports, can have a big impact on the markets. Additionally, company-specific news, such as earnings reports and management changes, can also affect the price of a stock. By staying informed and aware of the latest developments, you can make more informed trading decisions.

    Use stop-loss orders
    Stop-loss orders are an important risk management tool for swing traders. They allow you to set a specific price at which your position will be closed, in order to limit your potential losses. In a volatile market, it is especially important to use stop-loss orders, as they can help you protect your capital.

    Be flexible
    In a volatile market, it is important to be flexible and adapt to changing conditions. This means being willing to change your trading plan as necessary, and being open to new ideas and strategies. Additionally, it is important to be willing to take profits when they are available, rather than holding on to a position in the hopes of making more money.

    Stay disciplined
    Finally, it is important to stay disciplined and stick to your trading plan in a volatile market. It can be easy to get caught up in the excitement of a market swing and make impulsive decisions. By staying disciplined and sticking to your plan, you can avoid making mistakes and increase your chances of success.

    In conclusion, swing trading in a volatile market can be a challenging task. However, by using technical analysis, keeping an eye on the news, using stop-loss orders, being flexible, and staying disciplined, you can navigate the uncertainty and increase your chances of success as a swing trader. Remember, the key is to always have a plan in place before entering a trade and stick to it even in the most volatile conditions.

  • 5 Essential Things That Every Swing Trader Should Do

    What is Swing Trading?
    Swing trading is a popular way to invest. It involves holding a stock or other security for a short time, usually a few days to a few weeks, in the hopes of making money from short-term price changes. Swing trading is a good way to make money, but it also has its own challenges and risks. To be a successful swing trader, you need to know a lot about the markets and have a clear plan.

    In this blog post, we’ll talk about the five most important strategies for swing trading.

    Have a trading plan that is clear
    As a swing trader, having a clear plan for how to trade is one of the most important things you can do. This plan should include where you will enter and leave the market, as well as how you will handle risks. Your trading plan should also include the tools and indicators you will use to make decisions. Having a clear plan will help you stay focused and follow through, and it will also keep you from making decisions on the spot.

    Make use of technical analysis
    Technical analysis is the study of past market data to find patterns and trends that can be used to make trading decisions. It is an important tool for swing traders because it can help you find entry and exit points as well as possible areas of support and resistance. For technical analysis, you can use many different tools and indicators, such as moving averages, the relative strength index (RSI), and Bollinger Bands.

    Check out the news
    Keep an eye on the news is another important tip for swing trading. This includes both news about the economy, like decisions about interest rates and GDP reports, and news about a specific company, like earnings reports and changes in management. The news can have a big effect on the markets, and knowing what’s going on can help you make better trading choices.

    Care for your risks
    Managing risk is an important part of swing trading. Because you only have a stock or other investment for a short time, you are more likely to lose money. To avoid this risk as much as possible, you should know how much you can lose and use stop-loss orders to protect yourself. Also, it’s important not to trade too much and to keep the size of your positions at a level you’re comfortable with.

    Stay patient
    Lastly, one of the most important things you can do to make money swing trading is to wait. It’s important not to make decisions on the spot and to wait for the best times to enter and leave the market. Also, it’s important not to trade too much because doing so can cause you to lose money you don’t need to. As a swing trader, you can increase your chances of success by being patient and following rules.

    In conclusion, swing trading can be a great way to make money, but it also has its own challenges and risks. To be a successful swing trader, you need a clear trading plan, to use technical analysis, to keep up with the news, to manage your risk, and to be patient. By using these five tips, you can improve your chances of success and make more money swing trading.

  • Ichimoku – The Little-Known Japanese Indicator

    Ichimoku, also known as the Ichimoku Kinko Hyo, is a Japanese technical indicator that is little-known outside of Japan. It is a comprehensive indicator that provides a lot of information in one chart and can be used to identify trends, support and resistance levels, and even generate trading signals.

    The Ichimoku indicator was developed in the 1930s by a Japanese journalist named Goichi Hosoda. The indicator is composed of five lines, each with a specific purpose: the Tenkan-sen, Kijun-sen, Senkou Span A, Senkou Span B, and the Chikou Span.

    The Tenkan-sen, also known as the conversion line, is a moving average of the highest high and the lowest low over the past nine periods. It is used to identify short-term trends and can also be used to generate buy and sell signals.

    The Kijun-sen, also known as the base line, is a moving average of the highest high and the lowest low over the past 26 periods. It is used to identify medium-term trends and can also be used to generate buy and sell signals.

    The Senkou Span A, also known as the leading span A, is the midpoint between the Tenkan-sen and Kijun-sen. It is plotted 26 periods ahead and forms one of the boundaries of the “Ichimoku cloud.”

    The Senkou Span B, also known as the leading span B, is the midpoint between the highest high and the lowest low over the past 52 periods. It is plotted 26 periods ahead and forms the other boundary of the “Ichimoku cloud.”

    The Chikou Span, also known as the lagging span, is the current closing price plotted 26 periods behind. It is used to confirm trends and can also be used to generate buy and sell signals.

    The “Ichimoku cloud,” also known as the Kumo, is the area between the Senkou Span A and Senkou Span B lines. It is shaded to indicate a bullish or bearish trend. When the price is above the cloud, it is considered bullish and when the price is below the cloud, it is considered bearish.

    The Ichimoku indicator can be used in a variety of ways, but one of the most popular ways is to use it to identify trends. When the price is above the cloud, it is considered bullish and when the price is below the cloud, it is considered bearish. It is also possible to use Ichimoku to identify support and resistance levels by looking at the positions of the various lines.

    Another way to use the Ichimoku indicator is to generate trading signals. One of the most popular signals is the “golden cross,” which occurs when the Tenkan-sen crosses above the Kijun-sen. This is considered a bullish signal and can indicate that it is a good time to buy. On the other hand, a “death cross,” which occurs when the Tenkan-sen crosses below the Kijun-sen, is considered a bearish signal and can indicate that it is a good time to sell.

    Ichimoku is a comprehensive indicator that provides a lot of information in one chart. It can be used to identify trends, support and resistance levels, and even generate trading signals. However, it’s important to keep in mind that the Ichimoku indicator should be used in conjunction with other forms of analysis, such as fundamental analysis and other technical indicators, in order to make more informed trading decisions.

    It’s also worth noting that the Ichimoku indicator is not commonly used in the Western world and may not be supported by all charting software. However, for traders who are interested in using this indicator, specialized software can be found to support it.