Tag: technical analysis

  • The Anatomy Of A Perfect Breakout Trade

    Buying the breakout is a strategy in which you wait for an asset’s price to turn around and then try to invest in the early stages of its rise. (Some traders also use the word “breakout” to describe sharp price drops that happen after a time when prices went up or were stable.) When the decline stops and things start to get better again, this is called a “breakout.” The goal is to come together before the asset gains a lot of value.

    A retest happens when a stock price breakthrough is followed by a trend reversal and a return to a predetermined price range, such as the area around its 21-day simple moving average. Most of the time, the price goes back to where it was before the breakout. After that, it goes back to the way it moved before it broke out.

    When you buy the retest, you wait until after the breakout and buy the asset when it goes back into the range it was in before the breakout. This is helpful because it lets you move more methodically. You don’t have to invest right away because you don’t want to miss out. A retest also usually means that prices will be more stable in the future. The second breakthrough price range is more likely to hold.

    The problem with buying the breakout is, of course, that you can’t be sure when a breakout will happen until it has already happened. Even if an asset continues to lose value, its price can change from time to time. Sometimes, though, the asset has been revalued over a long period of time. In this case, any price changes will be made within a range of the new normal. You try to be right by making the best guess you can about what will happen to the price.

    And the problem with waiting for a retest is that it may never come. A very powerful breakout might be so strong that the price might breakout of a range and never move back inside if it. That is why, it is important for you to perform your own backtests and ensure that you choose a versatile strategy that lets you make the most of it.

    The most common indicator that intraday traders use to trade retest breakouts is the VWAP. It is the Volume Weighted Average Price that the price often moves to before moving again. For example, you mark the high and low of the 15 minute range of Nifty, and see a breakout happening at the high, then wait for it to come back to the VWAP before initiating a long trade. This will give you an attractive Risk:Reward Ratio.

    If you would like to start trading breakout strategies, open your best trading account with Zebu today.

  • How to Avoid False Breakouts?

    How can we avoid false outbreaks?

    Since this is a problem that many traders face, it was also the reason we wrote this post. At first, trading breakouts may seem easy, but they quickly become hard to do in real time.

    This article gives you five important tips for trading breakout setups with more success and confidence.

    Let’s begin.

    Rule 1: Change the map and look for patterns.

    No trader knows for sure if a breakout will work or turn out to be a false break. As usual, the market decides what to do and what to say. We traders must listen and follow, NOT the other way around.

    Many traders make the mistake of studying and making predictions about the markets, only to blame the market when their predictions don’t come true. Trading doesn’t operate like this.

    The most likely path of least resistance, which acts as a road map for pricing, needs to be found over and over again. This is not a set path, and you have to keep improving it.

    Also, keep in mind that chart patterns come first, and breakout trade ideas come after that. Learn and recognise all chart patterns, or at least the most common ones.

    For example, if you know what a contracting triangle is and how it is expected to form five waves (ABCDE), you can figure out when to expect a real breakout.

    Rule 2: Wait for breakouts with strong candlesticks

    We can tell if a breakout is successful by looking at how strong the candle closes. When the candlestick closes close to the high or low, this is called a powerful candle closure.

    How a breakout setup and a candlestick closure work together is as follows:

    A strong bullish breakthrough is shown by a candle that closes close to the high.
    When a candle closes close to the bottom, this is a strong sign that the price is going down.
    The power can also be seen in the size of the candle. Compared to the other candles in that time frame, a big breakout candle is shown by a big candle, not a small one. Even though candle size is important, how close the candles are to each other is more important.

    Rule 3: The break of the break

    Traders love trading breakouts by focusing on a single time frame, watching for a drop, and then letting the trade develop. If you could see a pattern on a 4-hour chart, for instance, you would zoom in on a 1-hour chart and look for a smaller pattern to show up over that time. Why?

    Because when price makes a pattern after a big breakout, it shows that the breakout is real. It shows that the price is in fact making a new correction after gaining momentum. Price psychology in the market suggests that this is a sign of more of the same.

    If prices don’t form a pattern after the breakout, it’s likely that they will turn around and move quickly in the opposite direction. If that’s the case, the price is either making a false breakout or has hit a major support or resistance level and is now strongly going back up. In any case, it’s smart to stay outside.

    Rule 4: Candle Close and Body Above the Support and resistance

    Reviewing how market activity relates to the support or resistance (S&R) level is a good approach when employing moving averages and trend lines.

    When the candle body is above the MA or trend line (50% is respectable), the breakout is at its finest.

    By following these tips, you can avoid a significant amount of false breakouts. To open a demat account with Zebu and start trading breakouts today, please get in touch with us.

  • How To Trade With Support And Resistance


    Title Page Separator Site title

    Technical analysts use a number of rules to predict how much stocks will go up or down in the future. Once you know what a trend is, the next important idea in technical analysis is support and resistance.

    The theory of support and resistance

    According to technical analysis, when the price of a stock reaches certain predetermined price points, it tends to stop and move in the opposite direction.

    Support level: This is the point where the price of a stock stops going down. It’s possible that the price will go up instead of down. At this point, it is likely that the demand from buyers will be much higher than the demand from sellers.

    Resistance level: The opposite of a level of support is a level of resistance. It is a price level (ceiling) above which the stock price is not expected to rise. At this price, the market for this stock is better for sellers than it is for buyers.

    What does support mean?

    The support and resistance levels on a candlestick chart might help you figure out the target price at which to buy or sell. The support level is where the market expects more buyers than sellers. The price at which traders can expect to see the most buying interest in a stock is called the support level on the chart.

    In a falling market, the support-resistance indicator, which is an important level market player to watch for, is often a sign to buy. The support line is formed when the price of a security goes down and the demand for shares goes up.

    What is resistance?

    On a candlestick chart, a price has reached the resistance level when there are more sellers than buyers. Resistance level is a price point on the chart where traders expect to sell as much of a certain stock as they can. It keeps the price from going up even more.

    Since resistance is always higher than the current market price, it is often a sign to sell. In a bullish market, the resistance level is one of the most important things that traders pay close attention to. Support and resistance are, in a nutshell, the exact opposites of each other.

    By looking at the support and resistance levels, the trader can get an idea of how the price of a stock will move. But there is always a chance that the stock price will go above these levels. When this happens, which happens often, a new level of support and resistance is set up.

    If the support level is broken, the stock price will keep falling until it finds a new level to support it. Also, if the stock price breaks through the resistance level, it keeps going up until it hits a new resistance level.

    Resistance and Support: How Reliable Are They?

    Even though support and resistance can tell you when to buy or sell, you shouldn’t rely on them alone. Or, to put it another way, before deciding whether or not to buy or sell a certain stock, you should think about a number of other things.

    When it comes to technical analysis,
    Predicting the future price of a stock is the most important (and hard) part of analysis for a trader in the stock market. The next high (or low) price cannot be predicted with any level of reliability.

    So, the idea of support and resistance is a good way to understand how prices change. Support and resistance levels help traders make decisions because they let them see patterns.

    For example, if a trader sees that a stock has reached a support level, he could buy more shares. This is done so that the stock has a better chance of coming back. In a similar way, the trader may sell his shares and make money when the stock reaches a level of resistance.

    When a stock’s price reaches these levels, you should always be careful because the area between the support and resistance levels is known to be very volatile.

    Conclusion

    Traders can use the idea of support and resistance to spot trends in the stock market and take advantage of them.

    This doesn’t mean, though, that the stock will never go above a support or resistance level. The price of a stock can always go up or down. Also, as a trader, you shouldn’t make trades based only on these levels.

  • Trendline Trading Strategies For Beginners

    Individual traders tend to utilise technical analysis more frequently than fundamental analysis, so trendlines are particularly popular in both forex and cryptocurrency trading. Interest rate movements affect forex markets, yet central banks’ established interest rates seldom fluctuate. This implies that prices fluctuate in line with traders’ predictions of interest rates, which are far more difficult to interpret. Price action and analytical tools like trendlines, according to technical experts, are the most reliable ways to gauge the sentiment of traders.

    Trading strategies using trendlines

    There are other methods to employ trendlines, but in this article, we’ll go through the two most popular trendline trading techniques as well as a third, less well-known but extremely viable, strategy.

    1) Trendline reversal

    Trading in accordance with the trendline-supported trend is the aim of this technique. Either purchasing or selling near to an uptrend or downtrend line.

    Steps in the plan:

    Decide if the price is moving up, down, or sideways.
    Create a trendline that connects at least three swing points.
    the trendline be extended into the future
    A) Watch for a subsequent price contact of the trendline B) Place a limit order at the trendline (adjust as price moves)
    When the price has reached the trendline, place a trade in the trend’s direction.
    In an upswing, place a stop-loss order under the prior swing low (above the previous swing high in a downtrend)
    Place a take profit order with a minimum ratio of 2:1 to the stop loss size.
    Example of a chart: trendline bounce

    2) Trendline break-through

    Although the trendline breakout may be utilised to trade against the trend, that is not what we are promoting here. How is breaking a trendline a trend-following tactic? Trading the breakout of short-term trendlines in the direction of the main trend is how it’s done!

    Steps in the strategy: identify a long-term trend
    Wait for a price “correction” or buck the general trend.
    Create a trendline to represent this recent correction.
    Keep an eye out for the price to go over this trendline.
    A) Place a stop order past the trendline to enter on the breakout B) Buy at the break of a downtrend line or sell at the break of an uptrend line
    On the other side of the trendline, place your stop loss order.
    Place a take profit order with a minimum ratio of 2:1 to the stop loss size.

    Examples of charts: inner trendline breakout

    3) Confluence between trendlines

    The use of trendlines is effective, however no technical indicator or price action trading strategy is faultless. Using many analysis techniques and watching for possibilities when they all come to the same conclusion will always boost your chances of success on a transaction.

    For instance:

    Using Fibonacci retracements, draw trendlines
    In this illustration, a buying opportunity at a rising trendline is supported by one at the 61.8% Fibonacci retracement level.

    Moving averages and trendlines
    In this instance, a rising trendline coincides with the prominent 200-day moving average.

    Japanese candlestick designs with trendlines
    In this case, bullish engulfing candle patterns help trendline bounces.

  • How To Trade With The Trendline

    Trendlines are one of the most simple and useful tools that traders use. Read on to find out what they are, how to draw them, and the best ways to trade based on trendlines.

    What is a trendline?

    A trendline is a line that is drawn through a chart to show the trend. On price charts, trendlines are drawn to show the general direction of prices in the trading environment. Traders use this information to decide whether to buy or sell in the direction of the trend. Trendlines can be used to track the price of a stock, a currency pair, or a cryptocurrency. In technical analysis, trend lines are one of the most common ways to show how prices are moving.

    A good example of how a trendline works

    Usually, a trendline is made by drawing a straight line between a number of swing highs or swing lows. For an up-trend line and a down-trend line, the swing lows and swing highs are used. In this method, the trendline helps traders understand till when a trend can continue. These can also be thought of as dynamic support and resistance points.


    Starting on the left side of the chart and moving the line to the right is how you draw a trendline. As a general rule, a trend line must go through at least three price “swings” before it can be taken seriously.

    How to use trend lines in trading

    Use a trend line to figure out the direction of the price trend. Traders can then choose to go with the trend if they think it will keep going or against the trend if they think it will change. Both strategies use the same way to read the trendline.

    Bullish because the price is above the uptrend line, which means the trend is going up.
    Bearish because the price is below a line that shows the price is going down.

    Trend following

    Trend following is a way to trade where you buy when the price is going up and sell short when the price is going down. A common trading strategy is to use an uptrend line to figure out if the general price trend is going up. A decline can also be shown by a line going down.

    Trading against trend

    Countertrend trading is a way to trade where you sell when the price goes up and buy when the price goes down. This is more like the basic rule of investing, “Buy low and sell high.” Reversion to the mean says that after a price trend goes in one direction, it will eventually go back to its average price. This is why short-term traders trade against the trend.

    The following point is one of the most important pointers to remember while using a trendline.

    Using a trendline when there is no trend is the worst mistake you can make as a beginner with trendlines. The clue is in the name!

    The best angle for a trend line is 45 degrees. Even if the trend keeps going in the same direction, a slope of more than 45 degrees means that the price is going up too quickly and could easily break the trendline. Less than 45 degrees means that the trend is weaker and is almost trading sideways.

    Three times in total

    As a trendline goes through more swing points, more traders can see it. This makes the trendline stronger. But after five touches, the chances of the trendline “breaking” are much higher.

    Zoom out

    To see where the trend you’re trying to show with the trendline started, make sure to zoom out on your trading platform’s chart. For example, if you want to draw an uptrend, try to start your trendline at the bottom of the previous downtrend or at the swing low.

    Five trendlines zones

    Trendlines are not based on good science. Price doesn’t often hit a trendline right before it turns around. The trendlines shouldn’t be taken as a specific price but as an “area” of prices. Having this information makes it easier to choose an entry price and a stop loss.

  • Everything You Should Know About Breakout Trading


    Did you know that sometimes on the stock market, fake breakouts can happen? But what are breakouts? How can you tell if a breakout is real or not?

    Assume that there is a resistance for the market at 18,000. When the price reaches there, sellers might come in and try to push the price down. However, if the price manages to move above 18,000, then it is called a breakout.

    Similarly, you could say that there is some support. When the price gets to the support level, everyone buys. When the price hits this level twice in a row, it means something. When there is a third strike and the price goes through the support level line, this is called a breakdown. Simply put, breakouts and breakdowns are a rise and a fall.

    First, let’s talk about what “breakout” means. What price action will help you the most if there is a breakout? For our breakout to happen, a bullish engulfing pattern must form. Now, the price breakout should be supported by the volume breakout, which means that when the price breakout happens, there should be a lot of volume. This can be seen when the volume bars at the bottom of the chart break over the black line that shows the volume line. The first thing is that a bullish engulfing candle pattern forms, and this is the second thing.

    The third and most subtle trait is called consolidation. Think about how the market always forms bullish candlestick patterns right before a breakout during intraday trading on a 15-minute time frame. Many people think the upward trend is reliable, but they will learn over time that after the candle breaks out, smaller green candles, a doge, and finally a huge giant red candle are seen, and smaller red candles start moving sideways. As a result, a lot of people lose. Then, how can we stop this?

    Consolidation. When a breakout happens, it should follow a significant pattern, like three or four contact points. This tells us that the breakout is real, and the breakout of the candle and the volume should back this up. If there has been no consolidation and there is a straight breakout, there is a higher chance that the trade will fail. We should enter those breakout trades when there is a strong consolidation.

    The fourth quality is that it’s been tested more than once. It’s important to test the level of resistance more than once. Let’s say that over the course of 15 minutes, you can see a lot of consolidations against the resistance level, that the resistance line has been reached before and really broken through the day before. It will be less likely that the stock will break through resistance.

    When we talk about breakdown, it’s for the same reason that bearish engulfing candle patterns, the volume breakout, consolidation, and several tests all work. Once all of these checklists are met, then you can go ahead and take your trade. As always, follow a strict stoploss.

    Breakout trading is a simple price action strategy that can work wonders if you know how to prevent false breakouts. To open a trading account with Zebu and start trading breakout strategies today, please get in touch with us.

  • How To Get Started With Algo Trading

    As a regular investor, here’s how you can start Algo trading.

    As top brokers in share market , Zebu, allows you to use algo trading for free, along with offering the lowest brokerage for intraday trading options and proving users with the best trading accounts

    1. Learn about the market

    Before you do any kind of trading, you need to learn about the market. Before you start Algo trading, you should learn as much as you can about the instrument or market you can trade in. This will help you come up with a hypothesis that you can use to guide your trades.

    2. Know how to code

    If you don’t know how to code, you can learn a language like Python and make an algorithm that works for you, or you can pay a professional to do it for you.

    3. Backtesting

    You must test your algorithm before putting it into use. Back-testing is a way to make sure that your strategy will work in the future. You can also use software from a third party to check if your algorithms work. You can change your code based on whether or not they work.

    4. Decide on the Best Platform

    As crucial as your coding is, you must also choose the correct broker and platform. Choose a broker that supports your algorithm and gives you a variety of tools to help you improve your trading strategy. For example, at Zebu we offer a free algo-trading provision that traders can use to execute their trades. If you would like to know more, please get in touch with us.

    5. Go Live

    When you’re happy with your algorithm, take it live. Monitor its market and real-world performance. Your algorithm might not always work. You might then have to start over or make changes to fit your needs.

    6. Keep Evolving

    Even if your first strategy doesn’t work, you don’t have to give up on algorithmic trading. Keep trying out different codes to see what works best.

    If you don’t have the time or skills to make your own algorithm, you can buy Algo software that will do the job for you. Do your research, try out the strategies with past data, and choose the one that works best for you.


    Conclusion

    Traditional investors can boost their trading approach by trying Algo trading. You can take advantage of short-lived trading chances that you would have missed otherwise. Algo trading can help you become a good trader who is quick, efficient, and successful.

    Is algo trading costing you a bomb? Zebu, As top brokers in share market allows you to use algo trading for free, along with offering the lowest brokerage for intraday trading options and proving users with the best trading accounts.

  • Three Of The Most Commonly Used Pullback Strategies

    Are you aware that one of the most fundamental trading methods is to trade trend pullbacks? Yes! There are numerous strategies to earn from pullback trading.

    You may profit from trading pullbacks across all time frames. This is because a trend can occur on any time scale, from the 5-minute to the monthly.

    Before we get into commonly used pullback strategies we would like you to know that at Zebu, one of the fastest-growing brokerage firms in the country, we have created the best Indian trading platform with the lowest brokerage for intraday trading.


    In today’s blog, we’ll present six profitable pullback trading strategies, but first, let’s define pullback trading:

    What does the term “Pullback Trading” mean?

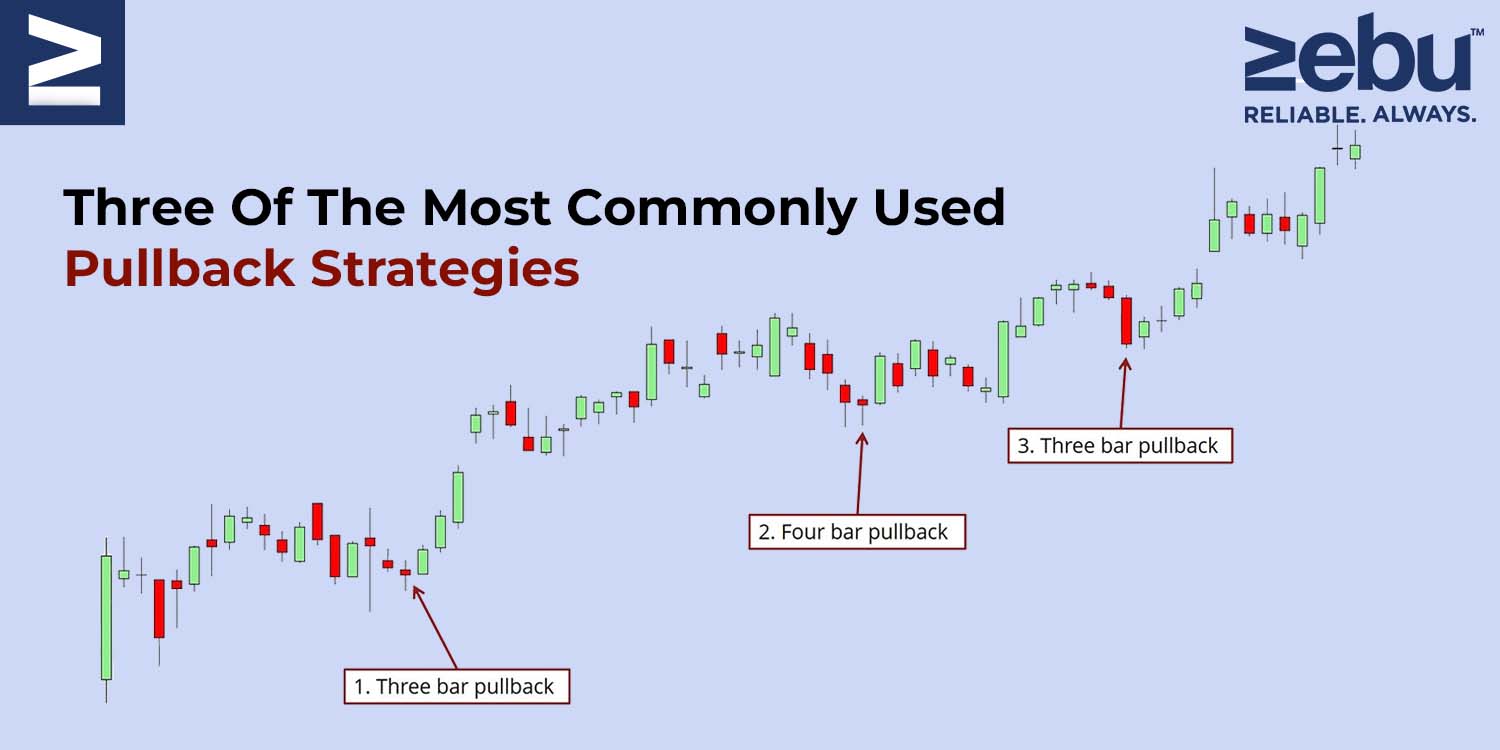
    A pullback is a temporary halt or little decline in the price of a stock or commodity that occurs during an ongoing increase.

    A pullback is virtually synonymous with retracement or consolidation. The term “pullback” refers to brief price drops – say, a few consecutive sessions – before the uptrend resumes.

    Following a significant upward price movement, pullbacks are sometimes considered as buying opportunities.

    For instance, following a great earnings report, a stock may have a significant jump before reversing as traders liquidate existing positions. On the other side, positive earnings are a fundamental indicator that the stock will continue to climb.

    Most pullbacks see a security’s price move to a technical support level, such as a moving average or pivot point, before resuming its uptrend. Traders should pay special attention to these important support levels, as a breach below them may indicate a reversal rather than a retreat.

    Now that we understand what pullback trading is, let us explore several tactics for trading pullbacks:

    1. Pullback to a trendline
    Determining the trend’s direction should be quite straightforward. The swing high and low structure is the most straightforward way to recognise a trend.

    An uptrend is defined by a series of higher highs followed by a series of higher lows. Whereas a downtrend is defined by a series of lower lows and lower highs.

    The disadvantage is that trendlines are frequently validated more slowly. Three contact points are required to validate a trendline. You can always link two random locations, but it is only when you reach the third that you have a true trendline.

    As a result, traders can only trade the trendline pullback at the third, fourth, or fifth contact point.

    While trendlines perform well in conjunction with other pullback tactics, as a stand-alone strategy, the trader may miss numerous opportunities if trendline validation takes an extended period of time.

    2. Pullback to moving average

    Without a question, moving averages are one of the most often utilised tools in technical analysis, and they may be used in a variety of ways. Additionally, you can utilise them to trade pullbacks.

    A moving average of 20, 50, or even 100 periods could be used. It is irrelevant because it is entirely dependent on whether you are a short-term or long-term trader.

    Shorter-term traders utilise shorter moving averages to get hints more quickly. Naturally, shorter moving averages are more prone to noise and false signals.

    On the other side, longer-term moving averages move more slowly and are less subject to noise, but may miss short-term trading opportunities. Consider the advantages and downsides for your own trading.

    3. Pullback after a breakout

    Breakout pullbacks are extremely prevalent, and probably the majority of traders trade this price action pattern.

    Pullbacks following breakouts are frequently seen at market turning points, following the price breakout of a consolidation pattern. The most often used consolidation patterns are wedges, triangles, and rectangles.

    Open range breakout is another common strategy. Once the day’s 15 minutes low and high are marked, traders enter a long position once the upper limit is broken on a good volume. In this situation, it would be ideal to wait for a pullback to the vwap or the 15-minute high for a better risk:reward potential.

    As we mentioned before, trading and investments requires the best Indian trading platform and the lowest brokerage for intraday trading.. As one of the best brokerage firms in the country, we have created a powerful trading platform that makes analysis easy for you. To know more about its features, please get in touch with us now

  • Everything You Should Know About Elliot Waves

    In the 1930s, Ralph Nelson Elliott established the Elliott Wave Theory. Elliott argued that stock markets, which are widely assumed to function randomly and chaotically, traded in repeating patterns.

    In this article, we’ll go over seven crucial things that you should know about Elliot Waves. But before we get into that you need to understand that investment is also about choosing the right technologies. As one of the top brokers in share market, we at Zebu offer trading accounts with lowest brokerage, and an online trading platform to help you focus only on executing your strategies efficiently.


    We’ll look at the history of Elliott Wave Theory and how it’s applied to trading in this post.

    Waves

    Elliott suggested that financial market patterns are determined by investors’ dominating psychology. He discovered that swings in popular psychology usually manifested themselves in predictable fractal patterns, or “waves,” in financial markets.

    Market Forecasts Using Wave Patterns

    Elliott made precise stock market predictions based on reliable wave pattern qualities he found. An impulse wave always exhibits a five-wave pattern because it travels in the same direction as the broader trend. On the other hand, a corrective wave net travels in the opposite direction of the main trend. On a smaller scale, five waves can be detected within each of the impulsive waves.

    Interpretation of the Elliott Wave Theory

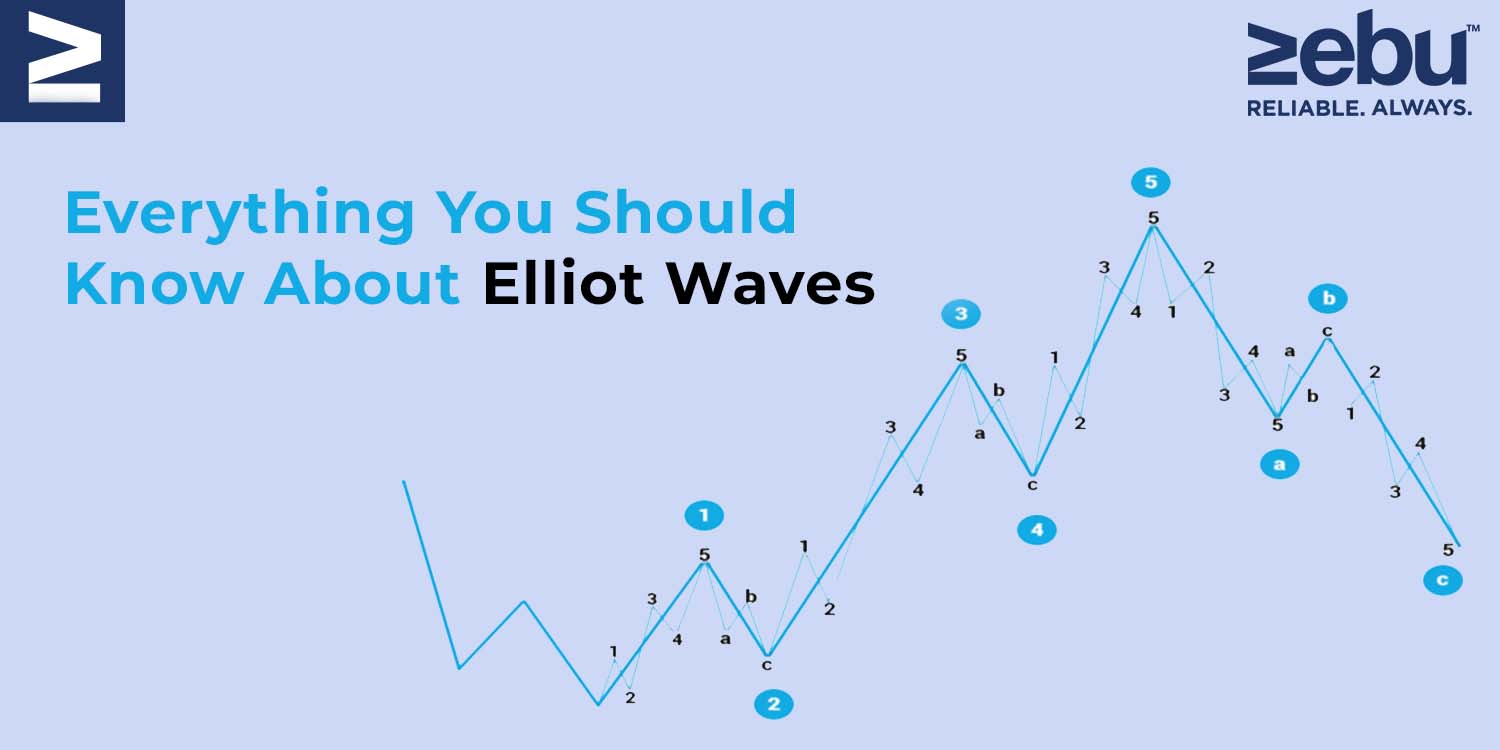
    Five waves advance in the direction of the primary trend, followed by three waves in the direction of the corrective (totalling a 5-3 move). This 5-3 move is then subdivided into two subdivisions of the following upper wave move.

    While the underlying 5-3 pattern remains consistent, the duration of each wave varies.

    Consider the following chart, which contains eight waves (five net upward and three net downward) labelled 1, 2, 3, 4, 5, A, B, and C.


    The impulse is formed by waves 1, 2, 3, 4, and 5, whereas the correction is formed by waves A, B, and C. The five-wave impulse, in turn, generates wave 1 at the next-largest degree, while the three-wave correction generates wave 2.

    Normally, a corrective wave consists of three independent price movements – two in the direction of the primary correction (A and C) and one in the opposite direction (B). Correction waves 2 and 4 are depicted above. Typically, these waves have the following structure:

    Take note that waves A and C in this illustration move in the direction of the trend at a greater degree, indicating that they are impulsive and composed of five waves. By contrast, Wave B is anti-trend and thus corrective, consisting of three waves.

    When an impulse wave is followed by a corrective wave, an Elliott wave degree containing trends and countertrends is formed.

    As illustrated in the patterns above, five waves do not always go in a net upward direction, and three waves do not always travel in a net downward direction. When the larger-degree trend is downward, for example, the five-wave sequence is downward as well.

    To apply the idea in daily trading, a trader may spot an upward-trending impulse wave, take a long position, and then sell or short the position when the pattern reaches five waves indicating a reversal is likely.

    The Verdict

    Elliott Wave practitioners highlight that just because a market is fractal does not automatically make it predictable. While scientists recognise a tree as a fractal, this does not indicate that the route of each of its branches can be predicted. In terms of practical application, the Elliott Wave Principle, like all other analysis methodologies, has its supporters and critics.

    One of the critical flaws is that practitioners can always blame their chart reading rather than flaws in the theory. Alternatively, there is an open-ended understanding of the duration of a wave.

    As we mentioned before investment is also about choosing the right technologies. As one of the top brokers in share market, we at Zebu offer trading accounts with lowest brokerage, and an online trading platform to help you focus only on executing your strategies efficiently.

  • Five Market Theories You Should Know About

    When it comes to investing, there are several theories on what makes markets tick and what a given market move indicates. The two major Wall Street factions are divided along theoretical lines: those who believe in the efficient market theory and those who believe the market can be defeated. Although this is a basic distinction, other theories attempt to explain and affect the market, as well as investment behaviour.

    If you are interested in investing or trading, then consider Zebu to get started, as a reputed share broker company we offer lowest brokerage options and a seamless online trading platform to help you with your investment journey.


    1. Theorem of Efficient Markets

    The efficient markets hypothesis (EMH) continues to be a point of contention. According to the EMH, the market price of a stock integrates all available information about that stock. This signifies that the stock is priced appropriately until a future event alters the price. Given the uncertainty of the future, a devotee of EMH is significantly better suited to owning a diverse range of companies and gaining from the market’s overall increase. You either believe in it and employ passive, wide market investment strategies, or you dislike it and concentrate on stocks with high growth potential, undervalued assets, and so on.

    Those who oppose EMH refer to Warren Buffett and other investors who have repeatedly outperformed the market by identifying irrational pricing inside the broader market.

    2. The Fifty-Percent Rule

    The fifty-per cent principle predicts that an observed trend will experience a price correction equal to about half to two-thirds of the change in price before continuing. This suggests that if a stock has been rising and gained 20%, it will lose 10% before continuing to increase. This is an extreme example, as this rule is frequently used for the short-term trends on which the technical analysts and traders trade.

    This correction is considered to be a normal component of the trend, as it is typically triggered by fearful investors taking profits early in order to prevent being caught in a true trend reversal later on. If the correction is greater than 50% of the price change, it is interpreted as a sign that the trend has failed and the reverse has occurred early.

    3. The Greater Fool Hypothesis

    According to the greater fool theory, investing is profitable as long as there is a greater fool than yourself willing to purchase the investment at a higher price. This means that you can profit from an overpriced stock as long as another party is prepared to pay a premium to acquire it from you.

    As the market for any investment overheats, you eventually run out of fools. Investing on the basis of the larger fool theory entails disregarding valuations, earnings reports, and all other data. Ignoring data is just as risky as paying too much attention to it, and hence those who believe in the greater fool hypothesis may find themselves on the losing end of a market correction.

    4. The Theory of Odd Lot

    The odd lot hypothesis uses the sale of odd lots — small blocks of shares held by individual investors – to calculate the best time to invest in a firm. When small investors sell out, investors use the odd-lot theory buy-in. The underlying idea is that small investors are frequently incorrect.

    The odd lot theory is a contrarian technique based on a deceptively simple sort of technical analysis – odd-lot sales measurement. How successful an investor or trader is in applying the theory is highly dependent on whether he investigates the fundamentals of the firms the theory suggests or simply buys blindly.

    5. Prospect Theory

    Prospect theory is often referred to as loss aversion theory. According to prospect theory, people’s views of gain and loss are distorted. That is, people are more fearful of loss than of gain. When people are presented with two contrasting prospects, they will choose the one that they believe has a lower probability of ending in a loss over the one that promises the most gains.

    For instance, if you offer a person two investments, one that has returned 5% each year and another that has returned 12%, lost 2.5 per cent, and returned 6% in the same years, the person will choose the 5% investment because he places an irrational premium on the single loss while ignoring the larger gains. Both alternatives in the previous example generate a net total return after three years.

    As a reputed share broker company we offer lowest brokerage options and a seamless online trading platform to help you with your investment journey. Contact Zebu to know more on how to get started on your share market investment journey.