Tag: trading strategies

  • Everything You Should Know About Elliot Waves

    In the 1930s, Ralph Nelson Elliott established the Elliott Wave Theory. Elliott argued that stock markets, which are widely assumed to function randomly and chaotically, traded in repeating patterns.

    In this article, we’ll go over seven crucial things that you should know about Elliot Waves. But before we get into that you need to understand that investment is also about choosing the right technologies. As one of the top brokers in share market, we at Zebu offer trading accounts with lowest brokerage, and an online trading platform to help you focus only on executing your strategies efficiently.


    We’ll look at the history of Elliott Wave Theory and how it’s applied to trading in this post.

    Waves

    Elliott suggested that financial market patterns are determined by investors’ dominating psychology. He discovered that swings in popular psychology usually manifested themselves in predictable fractal patterns, or “waves,” in financial markets.

    Market Forecasts Using Wave Patterns

    Elliott made precise stock market predictions based on reliable wave pattern qualities he found. An impulse wave always exhibits a five-wave pattern because it travels in the same direction as the broader trend. On the other hand, a corrective wave net travels in the opposite direction of the main trend. On a smaller scale, five waves can be detected within each of the impulsive waves.

    Interpretation of the Elliott Wave Theory

    Five waves advance in the direction of the primary trend, followed by three waves in the direction of the corrective (totalling a 5-3 move). This 5-3 move is then subdivided into two subdivisions of the following upper wave move.

    While the underlying 5-3 pattern remains consistent, the duration of each wave varies.

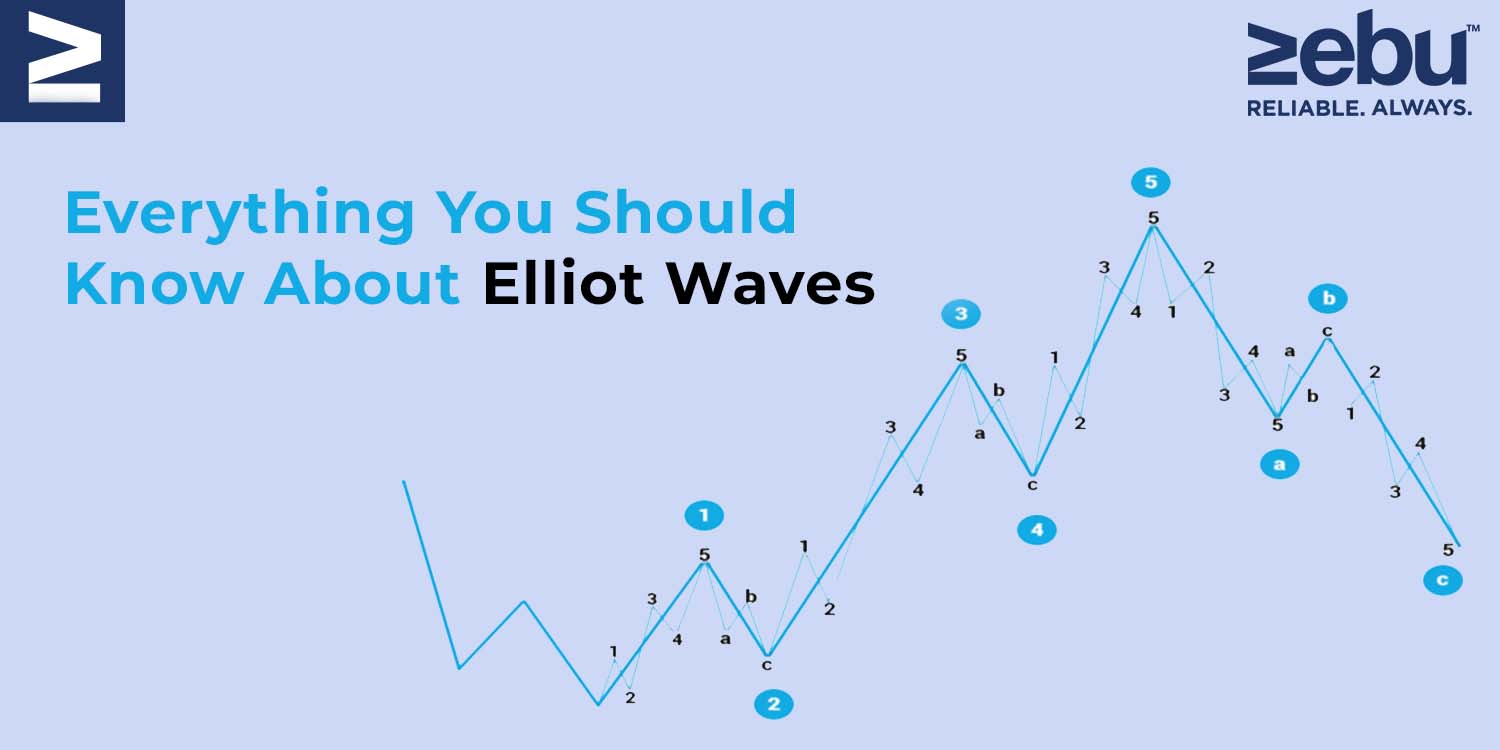
    Consider the following chart, which contains eight waves (five net upward and three net downward) labelled 1, 2, 3, 4, 5, A, B, and C.


    The impulse is formed by waves 1, 2, 3, 4, and 5, whereas the correction is formed by waves A, B, and C. The five-wave impulse, in turn, generates wave 1 at the next-largest degree, while the three-wave correction generates wave 2.

    Normally, a corrective wave consists of three independent price movements – two in the direction of the primary correction (A and C) and one in the opposite direction (B). Correction waves 2 and 4 are depicted above. Typically, these waves have the following structure:

    Take note that waves A and C in this illustration move in the direction of the trend at a greater degree, indicating that they are impulsive and composed of five waves. By contrast, Wave B is anti-trend and thus corrective, consisting of three waves.

    When an impulse wave is followed by a corrective wave, an Elliott wave degree containing trends and countertrends is formed.

    As illustrated in the patterns above, five waves do not always go in a net upward direction, and three waves do not always travel in a net downward direction. When the larger-degree trend is downward, for example, the five-wave sequence is downward as well.

    To apply the idea in daily trading, a trader may spot an upward-trending impulse wave, take a long position, and then sell or short the position when the pattern reaches five waves indicating a reversal is likely.

    The Verdict

    Elliott Wave practitioners highlight that just because a market is fractal does not automatically make it predictable. While scientists recognise a tree as a fractal, this does not indicate that the route of each of its branches can be predicted. In terms of practical application, the Elliott Wave Principle, like all other analysis methodologies, has its supporters and critics.

    One of the critical flaws is that practitioners can always blame their chart reading rather than flaws in the theory. Alternatively, there is an open-ended understanding of the duration of a wave.

    As we mentioned before investment is also about choosing the right technologies. As one of the top brokers in share market, we at Zebu offer trading accounts with lowest brokerage, and an online trading platform to help you focus only on executing your strategies efficiently.

  • Five Market Theories You Should Know About

    When it comes to investing, there are several theories on what makes markets tick and what a given market move indicates. The two major Wall Street factions are divided along theoretical lines: those who believe in the efficient market theory and those who believe the market can be defeated. Although this is a basic distinction, other theories attempt to explain and affect the market, as well as investment behaviour.

    If you are interested in investing or trading, then consider Zebu to get started, as a reputed share broker company we offer lowest brokerage options and a seamless online trading platform to help you with your investment journey.


    1. Theorem of Efficient Markets

    The efficient markets hypothesis (EMH) continues to be a point of contention. According to the EMH, the market price of a stock integrates all available information about that stock. This signifies that the stock is priced appropriately until a future event alters the price. Given the uncertainty of the future, a devotee of EMH is significantly better suited to owning a diverse range of companies and gaining from the market’s overall increase. You either believe in it and employ passive, wide market investment strategies, or you dislike it and concentrate on stocks with high growth potential, undervalued assets, and so on.

    Those who oppose EMH refer to Warren Buffett and other investors who have repeatedly outperformed the market by identifying irrational pricing inside the broader market.

    2. The Fifty-Percent Rule

    The fifty-per cent principle predicts that an observed trend will experience a price correction equal to about half to two-thirds of the change in price before continuing. This suggests that if a stock has been rising and gained 20%, it will lose 10% before continuing to increase. This is an extreme example, as this rule is frequently used for the short-term trends on which the technical analysts and traders trade.

    This correction is considered to be a normal component of the trend, as it is typically triggered by fearful investors taking profits early in order to prevent being caught in a true trend reversal later on. If the correction is greater than 50% of the price change, it is interpreted as a sign that the trend has failed and the reverse has occurred early.

    3. The Greater Fool Hypothesis

    According to the greater fool theory, investing is profitable as long as there is a greater fool than yourself willing to purchase the investment at a higher price. This means that you can profit from an overpriced stock as long as another party is prepared to pay a premium to acquire it from you.

    As the market for any investment overheats, you eventually run out of fools. Investing on the basis of the larger fool theory entails disregarding valuations, earnings reports, and all other data. Ignoring data is just as risky as paying too much attention to it, and hence those who believe in the greater fool hypothesis may find themselves on the losing end of a market correction.

    4. The Theory of Odd Lot

    The odd lot hypothesis uses the sale of odd lots — small blocks of shares held by individual investors – to calculate the best time to invest in a firm. When small investors sell out, investors use the odd-lot theory buy-in. The underlying idea is that small investors are frequently incorrect.

    The odd lot theory is a contrarian technique based on a deceptively simple sort of technical analysis – odd-lot sales measurement. How successful an investor or trader is in applying the theory is highly dependent on whether he investigates the fundamentals of the firms the theory suggests or simply buys blindly.

    5. Prospect Theory

    Prospect theory is often referred to as loss aversion theory. According to prospect theory, people’s views of gain and loss are distorted. That is, people are more fearful of loss than of gain. When people are presented with two contrasting prospects, they will choose the one that they believe has a lower probability of ending in a loss over the one that promises the most gains.

    For instance, if you offer a person two investments, one that has returned 5% each year and another that has returned 12%, lost 2.5 per cent, and returned 6% in the same years, the person will choose the 5% investment because he places an irrational premium on the single loss while ignoring the larger gains. Both alternatives in the previous example generate a net total return after three years.

    As a reputed share broker company we offer lowest brokerage options and a seamless online trading platform to help you with your investment journey. Contact Zebu to know more on how to get started on your share market investment journey.

  • Are You A DIY Investor? Here Are The Mistakes That You Should Avoid At All Costs

    Despite the fact that many institutional investors exited the market during the early stages of the epidemic, retail investors flooded in and gained handsomely, particularly in booming technology companies. Playing the market, of course, involves some risk. During the stock market’s unrelenting rally, reports of novices making rookie blunders and seasoned investors falling short came out.

    Before you start investing or trading, always consider going with one of the best brokerage firms in the country like Zebu. As a top broker in share marketwe have created one of the best stock trading platforms for you to use and invest.

    Here are six investing blunders you should avoid:

    1. Being in a Love-Hate Relationship With a Stock

    It’s all too easy to fall in love with a stock we’ve invested in and forget why we bought it in the first place when we see it do well. Always remember that you purchased this stock in order to profit from it. If any of the fundamentals that prompted you to invest in the company change, you should consider selling the stock.

    2. A Lack of Patience

    If you gradually and steadily build your portfolio, your long-term returns will be higher. Expecting a portfolio to do something it wasn’t designed to accomplish is a recipe for disaster. This implies you’ll need to keep your portfolio growth and return goals in check, as well as having a realistic time horizon in mind.

    3. Concerns About Investing

    One of the world’s most powerful investors, Warren Buffett, recommends against investing in companies whose business strategies you don’t understand. The safest method to avoid this is to invest in a diverse portfolio of exchange-traded funds (ETFs) or mutual funds. If you opt to invest in specific stocks on your own, be sure you have a thorough understanding of the firm.

    4. Entering without a strategy

    Going through with investments without considering issues such as one’s financial goals, risk appetite, or investing time horizon is not recommended. These are key considerations to address before beginning your financial adventure. As a result, it’s critical to keep track of these aspects, perform the appropriate back calculations, and ensure that one’s portfolio is on track to accomplish those objectives. It is suggested that you seek the advice of a financial advisor in this regard.

    5. Attempting to Forecast the Market

    If you don’t have the proper information, attempting to time the market might have a negative impact on your returns. It’s extremely difficult to time the stock market perfectly, and there are numerous biases at play while attempting to do so. Even institutional investors have difficulty precisely predicting this. Other approaches, such as SIPs, are therefore recommended for averaging out one’s investment over time. Furthermore, it is critical to allow your assets to compound and let the force of compounding to work its magic.

    6. Waiting for a Break-Even Situation

    Getting even is another approach to ensure that any profit you’ve made is wiped out. It suggests you’re delaying selling a loser until its original cost base is reached. In behavioural finance, this is referred regarded as a “cognitive malfunction.” When investors fail to recognize a loss, they lose in two ways. To begin with, they don’t want to sell a loss since it will continue to devalue until it is no longer worth anything. Second, there’s the lost opportunity cost of not putting those funds to greater use.

    Coming to a close…
    Making mistakes is unavoidable in the world of DIY investing. Knowing what they are, what you’re doing to make them, and how to stop them will help you succeed with your investments. Make a well-thought-out, planned stock market guidance strategy and stick to it to avoid making the blunders described above. It is advisable to avoid DIY without understanding and seek the advice of a financial counselor to fulfill one’s financial goals, just as one would not self-diagnose an illness and go to a doctor.

    As one of the top brokers in share market, we have created the best stock trading platforms for you to invest in wisely. Our tool is designed to help investors and traders alike to analyse a company with a wide range of indicators and screeners as per your strategy. As one of the best brokerage firms in the country, we invite you to open a trading and investment account with us.

  • 5 Myths About Technical Analysis Debunked

    TA is criticised by some traders and investors because they believe it is merely a surface examination of charts and patterns with no real effect on the market. However, there are many who feel that once they’ve mastered it, they’ll be rewarded with huge returns. Contrasting views on technical analysis have led to misunderstandings about how it is used.

    Misconceptions regarding technical analysis can be traced back to a lack of exposure to the subject in school. Someone who has just been taught the basics of trading may have little faith in technical analysis at all. If you have a background in technical analysis, though, you can still make money from it.

    These and other TA assumptions are the results of missteps and errors. For example, losses are sometimes caused by the bad use of technical indicators. That doesn’t necessarily mean that the strategy is bad; it could just be that the person needs more instruction and practice.

    Before we get into debunking myths about technical analysis, you need to make sure that you use the best broker for trading with the lowest brokerage on offer. Zebu empowers your online stock trading journey with a state-of-the-art trading platform as well.

    Here are eight of the most frequent technical analysis myths—and why they’re just not true.

    1. Short-term trading or day trading is the only use for technical analysis

    Many people believe that only short-term and computer-driven trading, such as day trading and high-frequency trading, may benefit from using technical analysis in their trading. It was long before computers were commonplace that technical analysis was used by long-term investors and traders rather than day traders. From one-minute charts to weekly and monthly timeframes, several types of traders use technical analysis.

    2. Technical analysis is only used by retail traders.

    Individual traders utilize technical analysis, but so do hedge funds and investment banks. Technical analysis is used extensively by the trading departments of investment banks. High-frequency trading is primarily reliant on technical ideas and accounts for a significant portion of stock exchange trading volume.

    Technical analysis has a low rate of success
    Successful market traders with a long track record of trading disprove this urban legend. A large number of successful traders attribute their success as a result of technical analysis and patterns. They do, however, attribute their success to strict discipline.

    3. Technical Analysis Is Quick and Efficient
    Trading success can be had by following a variety of technical analysis courses available on the internet. Despite the fact that many people begin trading by using simple technical indicators, long-term success in trading takes much education, practice, solid money management, and a strong sense of self-discipline. Technical analysis is merely a tool, a small portion of the larger picture to be considered.

    4. Price Predictions Based on Technical Analysis Are Accurate

    Many newbies expect technical analysts or software patterns to provide 100% accurate advice, which is not always the case. It’s common for new investors to expect a prediction like “stock ABC will hit Rs 200 in two months.” Technical analysts, on the other hand, tend to avoid quoting exact prices. They would rather give range-based predictions like a stock to move between 180 and 200 by the end of next week.

    Traders who place their bets based on technical analysis should be aware that it only provides a range of possible outcomes, not a specific value. When it comes to technical analysis, there are no assurances. Even if something doesn’t function 100% of the time, it can still be very profitable if it works more often than not.

    5. Technical Analysis should have a higher success rate

    Despite popular belief, it is not necessary to have a large percentage of successful trades to be profitable. In this hypothetical example, Peter has four successful transactions out of five, whereas Molly only has one win out of those same five trades. Who is the most successful person in their field? But even if the majority of people say Peter, we won’t know for sure until we have further details. Profitability is a function of victory rate and risk-to-reward tradeoff. It doesn’t matter if Peter wins Rs 20 and loses Rs 80; he still loses Rs 60. If Molly wins Rs 50 and loses Rs 10, she has a net profit of Rs 10. Even though she has had fewer victories, she is in a better position than she was before. Even if there are only a few winners in a deal, it can still be profitable.

    In conclusion

    Traders can use a wide range of tools and principles from technical analysis. There are successful traders who do not use it, and there are successful traders who do. Others argue that technical analysis is erroneous and theoretically unsound, despite the fact that many traders swear by it.

    Now that you have understood more about technical analysis, you also need to ensure that you use the best broker for trading with the lowest brokerage on offer. Zebu empowers your online stock trading journey with a state-of-the-art trading platform as well.

  • Trading Indicators To Use During Volatile Periods

    Many indicators are used by traders and analysts to monitor volatility and decide the best time for entering or exiting a trade. Increased fear in the market amid significant market movements can give ideal trading ground for experienced investors, while high volatility is typically a barrier to reckless trades. Low volatility and complacency among investors, on the other hand, can signal a bubble in the market and a possible market top. It is usual to utilise the volatility index (VIX), ATR and Bollinger Bands to measure volatility relative to other indicators.

    At Zebu, we understand that traders and investors with very high aspirations need nothing short of the best Indian trading platform with its plethora of features and scanners. As one of the top brokers in share marketin India, we have the privilege of providing our users with their best trading accounts.


    VIX

    Volatility in the market is measured by the Volatility Index. Volatility in Nifty 50 can be measured by a ticker symbol known as VIX, which is updated throughout the trading day and reflects the current implied or expected volatility. Other traders use large institutions’ volatility perceptions (as indicated by VIX) to help them gain an idea of the expected volatility of the market in the days to come.

    While numbers in the low teens imply minimal volatility, VIX rates above 30 indicate increased volatility.

    Average True Range

    Any stock, exchange-traded fund, FX pair or commodity can be used to apply the average true range indicator established by J. Welles Wilder Jr. ATR is a 14-day exponential moving average (EMA) of what Wilder called the “true range” of an asset’s price movement. One of three following equations produces the greatest number, which is used to determine the true range.

    Current day’s high minus the current day’s low
    Current day’s high minus the previous day’s close
    Previous day’s close minus the current day’s low

    Finally, an EMA is produced using the ATR (computed using the highest value found when the three equations are solved). The greater the ATR, the greater the volatility of the market. There is a correlation between ATR values and quiet trading periods.

    Bollinger Bands
    There are two bands or lines that are two standard deviations above and below a 20-day moving average, which shows as a line in between the two bands, in the Bollinger Bands indication, which is another charter indicator. The wider the bands, the more volatile the market is, and the narrower the bands, the less volatile the market is. Bollinger Bands, like ATR, can be applied to any chart of a stock or commodity.

    You can get one of the best Indian trading platforms with its plethora of features and scanners to build your investment portfolio. As one of the top brokers in share marketin India, we have the privilege of providing our users with their best trading accounts.

  • All The Ways In Which You Can Use VIX

    VIX is a contract that you’ve likely heard of if you’ve ever traded futures or options. The NSE VIX futures contracts can be traded in the same way that index and equity futures and options are. To begin, what precisely is a VIX contract? The volatility index (VIX) is a metric for market volatility, thus its name. Since a high VIX implies a high amount of fear in the market and a low VIX suggests a high level of confidence, it is commonly referred to as the Fear Index.

    Examine some strategies for trading the VIX in India and some methods for trading the VIX in general. Do you realise that the India VIX and the Nifty are negatively correlated? What you should know about VIX is summarised below.

    Before we get started on how you can use VIX, it is important that you have the right tools to trade efficiently. That is why as an online trading company we have created a high-end online trading platform with the lowest brokerage for you to maximize your returns from the market.


    It’s important to keep in mind that the VIX measures market expectations for volatility.

    To compute the VIX, VIX typically employs options expiring in the current month and the following month. According to the VIX, it is assumed that the premium on important Nifty options indicates the market’s implied volatility. Because of this, you can get a fair sense of how volatile the options are by averaging them. Expectations of more volatility are typically reflected in the price of options (both calls and puts). Nifty option order books are used to construct the India VIX. When determining the best bid-ask prices, we look at both the near-month and next-month Nifty options. As an indicator of how volatile India’s stock market is projected to be in the following 30 days. This is how the India VIX is computed:

    NSE calculates and distributes the VIX on a real-time basis, hence the formula is only for educational reasons. In order to fully grasp the VIX, it is necessary to understand how it is interpreted and what it means.

    How to use VIX in practise is a more important subject than its simple depiction of projected volatility or risk. This is how you can accomplish it:

    For equities traders, the VIX is an excellent and reliable indicator of market risk
    Stock traders who trade intraday and for the short term might use this information to gauge whether the market’s volatility is rising or falling. They’ll be able to fine-tune their approach. Intraday traders, for instance, run the danger of stop losses being swiftly triggered when volatility is projected to go up sharply. Consequently, they have the option of either reducing their leverage or widening their stop losses.

    For long-term investors, the VIX is a great indicator. Most long-term investors are unconcerned by the volatility of the stock market. The risk and MTM losses of institutional investors and proprietary trading desks, however, are limited. To play the market both ways, they can boost their hedges in the form of put options when the VIX shows a rise in volatility.

    Traders of options can potentially benefit from VIX as an indicator. When deciding whether to buy or sell an option, volatility is typically taken into account. In times of high volatility, options become more valuable and buyers are likely to profit more. Option sellers stand to gain when the VIX declines since more time value will be wasted.

    Volatility trading is also important. Consider buying strangles or straddling if you think the market will be more volatile in the future. However, when volatility is expected to rise, these become extremely expensive. In order to reap the benefits of volatility without having to worry about the direction of the market, you should buy futures on the VIX index itself.

    This index’s volatility is well-captured by the VIX. You can clearly detect a negative link between VIX and the Nifty if you map their movements over the previous nine years from the beginning of VIX. The volatility index (VIX) tends to rise and fall in tandem with the market’s overall performance. Index traders can use this data as an input.

    Portfolio and mutual fund managers can greatly benefit from the VIX index. When the VIX reaches its all-time high, investors can aim to increase their exposure to high beta companies, and when the VIX reaches its all-time low, investors can increase their exposure to low beta stocks.

    Although the India VIX has only been around for a little over a decade, it has already become a reliable indicator of market risk and volatility.

    As we mentioned earlier it is important that you have the right tools to trade efficiently. That is why as an online trading company we have created a high-end online trading platform with the lowest brokerage for you to maximize your returns from the market.

  • 5 Podcasts That Traders And Investors Can Enjoy

    Day trading podcasts can provide you with the best benefit of all: the interviewees can often provide a wealth of knowledge in a certain sector that would otherwise go unnoticed. In a nutshell, they’re a terrific source of fresh information and can help you make better decisions while you’re in the midst of a trade. Here are a few of the best ones you should follow.

    1. FREAKONOMICS Steven Dubner, the author of the bestselling book Freakonomics, hosts a podcast by the same name. Many people throughout the world have praised the book for its ability to explain economics in a way that is understandable to the general public. The Freakonomics podcast is listened to by thousands of people around the world every Thursday morning. The podcast itself has nothing to do with investing or trading. This is not the case, however, as he covers a wide range of issues and provides an economic perspective. The World Bank President Jim Yong Kim, TV celebrity Charlie Rose, and Vanguard founder Jack Bogle have all been on Dubner’s show. If you’re a trader, Freakonomics won’t tell you how to make the best investments. To the contrary, it will open your eyes to the small things that can improve your financial situation.

    2. FINANCIAL TIMES MONEY SHOW PODCAST It’s a weekly show, and it’s packed with useful information about personal finance. You and your wallet are in good hands with Claer Barrett and her team of FT Journalists (obviously) and prominent industry pundits. The Financial Times has a number of podcasts you can listen to in order to improve your day trading skills. ‘News in Focus’ and ‘Banking Weekly podcast’ are two other options for keeping up to date on the latest developments in the financial industry.

    3. TWO BLOKES This is a great podcast for beginner traders who are interested in the forex market, and it’s also a lot of fun to listen to. With a conversational tone in which they discuss their trading, Tom and Brandon prefer to talk about their own experiences rather than theory. Tom and Brandon conduct interviews from time to time, learning by doing so with the help of industry professionals they’ve invited on as guests. The Two Blokes trading podcast also includes evaluations of various trading tools and software, book reviews, and other topics.

    4. CHAT WITH TRADERS The host, Aaron Fifield, interviews day traders from around the world on a weekly basis in this podcast. Because this podcast shows you to parts of trading that you won’t find anyplace else, it is extremely significant. Sheelah Kolhatkar, the author of the previously stated book on Steve Cohen, was one of Aaron’s interview subjects. Morgan Slade, Nell Sloane, and Darren Reed are among the other merchants he has interviewed.

    5. RICH DAD RADIO SHOW This podcast, hosted by Robert Kiyosaki, is released every week. He meets with experts from a wide range of economic (financial, investment, and commercial) and personal development fields. Unlike many other shows, his thoughts on money, investment, and the economy are unapologetic, offering listeners a variety of perspectives on how to best position themselves for financial success. It’s a great method to motivate individuals to take charge of their own destinies and to provide guidance on how to reach their financial objectives. Which of these is your favourite?

  • Everything You Need to Know About Trailing Stop Losses

    Online brokers are always looking for new ways to keep investor losses to a minimum. One of the most popular downside protection techniques is a stop-loss order, which automatically sells a position at the current market price if the price drops to a specified level, preventing further losses.

    Before we get into the basics of trailing stop loss, it’s important to know that it takes a certain level of experience before you can become profitable. However, if you would like to get started, you need access to the best trading platform from one of the best online share brokers in the country. At Zebu, we give you all of this and more – we also offer the lowest brokerage for intraday trading.


    Trailing stop-loss order

    Traders can improve the effectiveness of a stop-loss order by combining it with a trailing stop, which is a trade order in which the stop-loss price is set at a percentage or rupee amount below the market price.

    When the price goes up, the trailing stop goes up with it. The new stop-loss price remains at the level it was dragged to when the price finally stops climbing, automatically safeguarding an investor’s downside while locking in profits when the price achieves new highs. Trailing stops can be used with regular stop-loss orders on stock, options, and futures exchanges.

    The Functions of a Trailing Stop

    Consider the following scenario for a better understanding of how trailing stops work:

    Buy price: Rs 100
    Price at the time of setting a trailing SL: Rs 100.5
    Trailing amount: Rs 1
    Immediate SL: 99.5
    If the market goes up to 101, the trailing SL will be moved up to 100.

    If the price goes back to 100, your SL order will be triggered and you will exit with a slight loss (considering slippage, taxes, and fees).

    It’s critical to avoid the need to reset your trailing stop during market dips, or your effective stop-loss will be lower than intended. When you notice momentum peaking in the charts, especially when the stock is hitting a new high, it’s also a good idea to rein in a trailing stop-loss.

    It’s critical to assess your maximum risk tolerance when using classic stop-losses with trailing stops. Set a stop-loss at 2% below the current stock price and a trailing stop at 2.5 percent below the current stock price, for example. As the price of the stock rises, the trailing stop will outperform the fixed stop, making it redundant.

    To make this approach work on current trades, you’ll need to select a trailing stop value that takes into account the stock’s regular price movements while catching just the genuine price decline. This can be accomplished by analysing a stock for several days before engaging in active trading.

    Furthermore, when using a trailing stop, there is the risk of setting it too tight during the early phases of the stock’s support. The consequence will be the same in this situation, with the stop being triggered by a temporary price downturn, leaving traders concerned about a perceived loss. This might be a difficult mental pill to take.

    You need the lowest brokerage for intraday trading as well as the best trading platform. As a leading online share broker, we at Zebu have created the perfect trading platform with an extensive amount of features to simplify trading for you.

  • Everything You Need To Know About Paper Trading

    With the rise of high-speed trading and algorithmic trading in the markets, day trading has become extremely competitive. But it is an extremely difficult field to succeed in. That is why you need to practice as much as possible.

    Executing paper trading requires a huge amount of analysis and the lowest brokerages you can find in India. As one of the fastest-growing stock broker companies in India, we at Zebu have created the best trading platform for calendar spreads and other futures and options strategies.


    What Is Paper Trading and How Does It Work?

    Simulated trading, often known as paper trading, allows aspiring traders to buy and sell stocks without risking real money. Investors might be able to replicate trading with a basic spreadsheet or even pen and paper, but day traders would find it difficult to manually record tens of transactions per day and calculate their profits and losses. However, there are many online platforms that provide paper trading accounts for people to practice with before investing real money in the market. This allows them to try out different techniques and get some practice with the software.

    Consider paper trading platforms that offer live market feeds before you start with real money while looking for the ideal place to practice your trades. This is critical since you’ll want to be able to trade without having to wait for delayed feeds or orders to be processed.

    TradingView is a commonly used market simulator that most traders get started with. To utilize the simulator, day traders on these platforms will need to open an account, which may include depositing the minimum funding requirements. The good news is that traders can practice with the simulator before risking their money on live transactions.

    It’s important to remember that there are some distinctions between simulated and live trading. Simulators may not account for slippage, spreads, or commissions, which can have a substantial impact on day trading returns on a technical level. On a psychological level, traders may find it simpler to follow trading system guidelines when there isn’t any money at stake—especially if the trading system isn’t performing well.

    Paper Trading Suggestions

    The way you trade on a given day is primarily determined by the approach you utilize. Some day traders, for example, rely solely on “feel” and must rely on paper trading accounts, whereas others utilize automated trading systems and backtest hundreds of systems before paper trading only the most promising. Traders should pick the finest broker platform for their needs depending on their trading preferences and then practice trading on those accounts. Here is where Zebu comes in.

    When paper trading, it’s critical to keep a detailed record of your trades and to follow your approach over a long enough time frame. Some methods may only work in bull markets, leaving traders vulnerable when the market turns bearish. In order to verify that their strategies hold up successfully and deliver the maximum risk-adjusted returns, it’s critical to test enough stocks in different market scenarios.

    Finally, paper trading isn’t only a one-time activity. Day traders should use the paper trading capabilities on their brokerage accounts on a frequent basis to test new and experimental tactics before entering the market. For day traders who risk tens of thousands of rupees in hundreds of trades every day, simple mistakes can be extremely costly. As a result, paper trading is an essential component of long-term success.

    Advantages of Paper Trading

    Starting with a paper trading account can help you learn more quickly. However, there are additional advantages to self-education. To begin with, there is no risk. You don’t lose anything because you aren’t utilising real money. You can assess your mistakes and develop a winning plan. This also helps you gain confidence and gives you the opportunity to practice the tactics and strategies required to be a good day trader, such as profit or loss taking and pre-market preparation. Finally, it reduces the amount of stress associated with trading. You may focus on your strategies in a calm environment, removing the emotional aspect of trading.

    Paper Trading’s Drawbacks

    While paper trading will provide you with the necessary practice, there are a few drawbacks. You don’t get a sense of how fees and commissions affect your trades because it doesn’t use actual money. These simulators also don’t truly depict market reality, including lows and highs, as well as the emotion that comes with trading. As a result, keep in mind that this is a simulated environment where you can practice your trading talents.

    Practice Makes Perfect

    If you are new to trading or investment, spend as much time as possible with paper trading before entering the live markets. Make an effort to experiment with new strategies and ideas so that you can become more comfortable. Ultimately, the goal of paper trading is to shorten your learning curve.

    When it comes to executing paper trading, you need access to the best trading platform from one of the most reliable stock broker companies in the country. We also complement our platform with the lowest brokerage for trading. Please get in touch with us to know more about our services and products.

  • An Overview of Volume vs. Open Interest

    Volume and open interest are two of the most important technical metrics for understanding options and the broader market. The amount of contracts exchanged in a given period is referred to as “volume,” whereas “open interest” refers to the number of contracts that are active, or not settled. We’ll look at these two variables and give you some pointers on how to utilise them to better understand trade activity in the derivatives markets. But before we get into that, there is one thing you will require: the best Indian trading platform with a wide range of features. With Zebu, one of the best stock brokers in the country, your online stock trading journey will be drastically enhanced.


    Volume

    In the stock market, volume refers to the number of times shares are traded between buyers and sellers. The volume metric for options markets gives the number of options contracts bought and sold in a given trading day, as well as the degree of activity for a specific contract.

    Every transaction counts against the daily volume, whether it’s an opening or closing transaction.

    The higher the volume, the more people are concerned about security. Volume is often used by investors to determine the strength of a price movement. More volume also suggests that the contract has more liquidity; this is advantageous in short-term trading because it means that there are more buyers and sellers in the market.

    Assume that the volume in call option ABC with a strike price of Rs 1000 and a three-week expiration date did not trade any contracts on a given day. As a result, the trade volume is zero. An investor buys 15 call option contracts the next session, and there are no other trades that day, thus the volume is now 15 contracts.

    The volume and open interest measurements reveal the amount of buying and selling that supports a prospective price change. In technical analysis, however, it is also necessary to determine whether the open interest is in calls or puts, as well as whether the contracts are being purchased or sold.

    Open Interest

    The quantity of options or futures contracts owned by active traders and investors is known as open interest. These positions have been created, but they haven’t been filled, expired, or exercised yet. When buyers and sellers (or writers) of contracts close off more positions than were opened that day, open interest declines.

    A trader must take an offsetting position or exercise their option to close out a position. When investors and traders open additional new long positions or sellers take on new short positions in an amount bigger than the number of contracts that were closed that day, open interest rises once more.


    Assume that the open interest in the ABC call option is 0 for example. The next day, an investor opens a new position by purchasing 10 option contracts. The number of people who have expressed interest in this particular call option has now reached ten. Five contracts were closed the next day, ten were opened, and open interest grew by five to 15.

    Open interest, along with other variables, is used by technical analysts to determine the strength of a market trend. Increased open interest signals the entry of new traders into the market and can be used to corroborate a current market trend. The current trend may be deteriorating as open interest declines, indicating that traders are closing their positions.

    Particular Points to Consider

    We’ve listed a few situations that include the volume and open interest indicators, as well as some possible interpretations.

    Rising prices during an uptrend, combined with rising open interest, can indicate that new money is entering the market (reflecting new positions). If long positions are fueling the growth in open interest, this might be an indication of a bullish mood.
    If, on the other hand, open interest falls while prices rise during an advance, this could imply that money is leaving the market, which is a bearish indicator.
    If, on the other hand, open interest falls while prices rise during an advance, this could imply that money is leaving the market, which is a bearish indicator.
    Prices falling in a downtrend while open interest rises could indicate that new money is entering the market on the short side. This scenario is negative since it is consistent with a continuous downtrend. However, falling prices in a downtrend with declining open interest may imply that holders are being compelled to liquidate their positions, which is a bearish indicator.

    If open interest is high as prices are falling sharply during a market peak, it could be a bearish indicator if those who bought near the top are suddenly losing money; this could also create a panic selling scenario.

    Option Chain And Its Working

    An option chain is a table that lists all of the available options for a certain security. An option chain displays all of the published calls and puts for a given expiry date, organised by characteristics such as strike price, expiration date, volume, and pricing.

    How much open interest and volume should an option have?
    In general, a high volume and open interest both indicate a liquid market with a large number of buyers and sellers for a specific option. Market mood can also be confirmed by changes in open interest and volume. A rising price with increasing volume and open interest, for example, indicates a robust market, whereas a rising price with declining volume and open interest indicates a weak market.

    When the Volume Exceeds the Open Interest, What Does It Mean?

    If an option has a high volume but a low open interest, it has a limited secondary market, which means it may have low liquidity. A trader trying to sell that option might have trouble finding a buyer, or they might face a wider bid-ask spread than usual.

    What Does a High Open Interest Indicator Indicate?

    A huge number of traders have taken active positions in an options or futures contract with a high open interest. If open interest rises over time, it indicates that new traders are taking positions in the market and that money is flowing in. When open interest decreases over time, it indicates that traders are beginning to close positions.