Tag: trading strategy

  • This could be your HOLY GRAIL of TRADING STRATEGY

    Good day! If you’re new to the stock market, you might have heard about the pursuit of the “holy grail” market strategy, a mythical investment method that ensures earnings and outperforms the market. The reality is that there is no such plan, which is unfortunate.

    This is why:

    No matter how much expertise or information a person has, they will never be able to predict the stock market with absolute certainty. There are simply too many factors at play, including, among others, current world events, interest rates, and modifications to industry rules. Due to unforeseeable occurrences that have an effect on the market, even the most experienced buyers occasionally suffer unanticipated losses.

    Every strategy has advantages and disadvantages: Each business strategy has a distinct collection of advantages and disadvantages. For instance, while some investors may concentrate on value investing, which entails buying stocks that are thought to be undervalued, others may favour growth investing, which entails making investments in businesses that are predicted to experience fast future development. Finding a plan that matches your financial objectives and risk tolerance is crucial.

    Future outcomes cannot be predicted by past performance, which is an essential consideration when choosing assets. However, it’s important to keep in mind that past performance does not ensure future success. Many investors make the error of buying into stocks that have recently done well in an effort to replicate prior performance, only to discover that these stocks don’t continue to perform as predicted.

    Investing entails danger: Every transaction carries a certain amount of risk. Even the most risk-averse financial plans, like putting money in savings accounts or government bonds, carry some degree of risk. When making stock market purchases, it’s crucial to recognise and control your risk tolerance, spread your holdings, and keep the long term in mind.

    Because there is no secret formula that ensures success in the stock market, the quest for the “holy grail” market plan is fruitless. Focus on creating a diversified investment portfolio that is in line with your objectives and risk tolerance rather than trying to find a singular strategy that performs well in all market circumstances. Remember, investing in the stock market takes perseverance, focus, and a long-term outlook.

    FAQs

    1. What does ‘Holy Grail’ trading strategy mean?

      A holy grail trading strategy refers to a system that supposedly works in all market conditions and guarantees consistent profits—a perfect method traders dream of.

    2. Is there a real “Holy Grail” strategy?

      No, there isn’t a strategy that always works. Even the best trading strategies need risk management and adaptation to changing markets.

    3. Which trading strategy is the most successful?

      The most successful strategy depends on your style and goals. Trend-following, breakout, and swing trading strategies are often effective when applied consistently.

    4. Is there a perfect trading strategy that always works?

      No strategy is perfect. Market conditions, emotions, and unexpected events mean losses are always possible.

    5. Why do people still talk about the “Holy Grail” if it doesn’t exist?

      Traders hope for a simple solution, so the idea of a “Holy Grail” keeps coming up as a motivational concept rather than a reality.
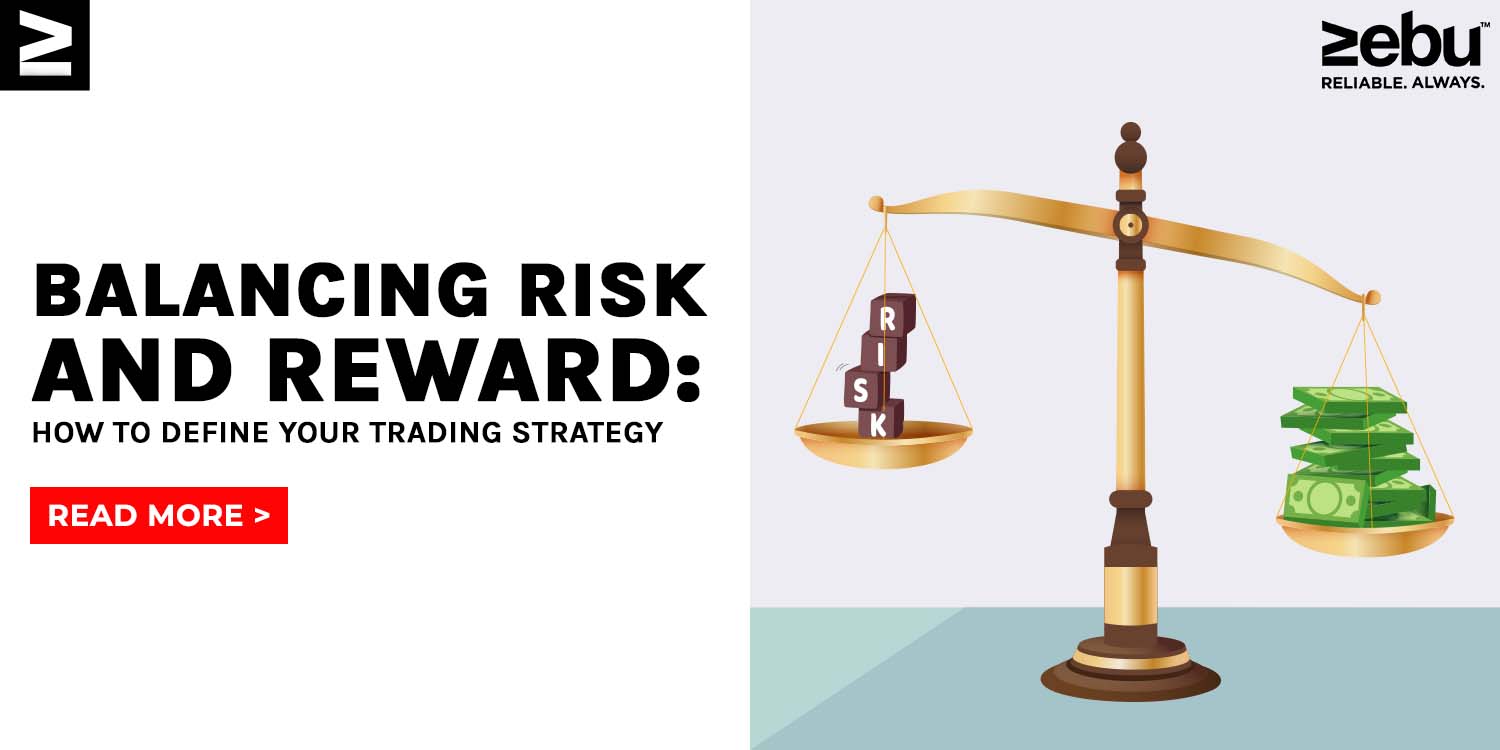
  • Balancing Risk and Reward: How to Define Your Trading Strategy

    Determining the risk and reward of your transactions is one of the most crucial components of any trading strategy. You may decide how much risk you’re prepared to take on in order to get the returns you want by looking at your risk to reward ratio. Here are a few important elements that traders should take into account when determining the risk and return of their approach.

    Market Circumstances: Your risk and return will be significantly influenced by the current market conditions. For instance, in times of extreme volatility, you might wish to trade smaller positions or use stop-loss orders to cap your losses in order to lower your risk. On the other side, when volatility is low, you might be able to take on more risk in the hope of reaping greater benefits.

    Trading Approach: The degree of risk and return you may seek will also depend on your trading approach. Swing traders, for instance, can be able to take on greater risk as they hold positions for several days or even weeks, but day traders would need to keep their risk to a minimum since they close out positions at the end of every trading day.

    Investment Horizon: How long you intend to maintain a position or your investment horizon may affect how much risk and profit you are exposed to. For instance, long-term investors could be able to take on more risk in the hopes of reaping greater benefits, but short-term traders might need to keep their risk to a minimum.

    Capital Management: When determining the risk and return of your plan, effective capital management is essential. You may guarantee that you have the resources available to weather times of market volatility and still accomplish your financial goals by managing your cash effectively. This can entail calculating the right size for your transactions using position sizing strategies like the Kelly criterion.

    Risk Management Techniques: Stop-loss orders and other risk management strategies will be crucial in defining the risk and return of your strategy. Even in the face of market volatility, you can preserve your wealth and reduce your losses by employing these strategies.

    Investment Objectives: The amount of risk and profit you may take on will depend on your investment objectives. For instance, if your primary goal is to generate income, you might need to keep your risk low and look for trades that offer lower returns but more consistency, but if your primary goal is to build your business, you might be able to take on more risk in the chase of higher returns.

    Trading Plan: When determining the risk and return of your approach, a clear trading plan is crucial. Your trading strategy should include an explanation of your approach to market analysis and trade execution, as well as your investing objectives, risk tolerance, and risk management strategies. You may stay focused and disciplined even during times of market turbulence by having a clear and well-defined trading plan.

    To sum up, one of the most important steps in making sure you succeed as a trader is identifying the risk and reward of your approach. Building a well-rounded strategy that balances risk and reward and aids in the achievement of your investment objectives can be done by taking into account variables like market conditions, trading style, investment horizon, capital management, risk management strategies, investment goals, and trading plan.

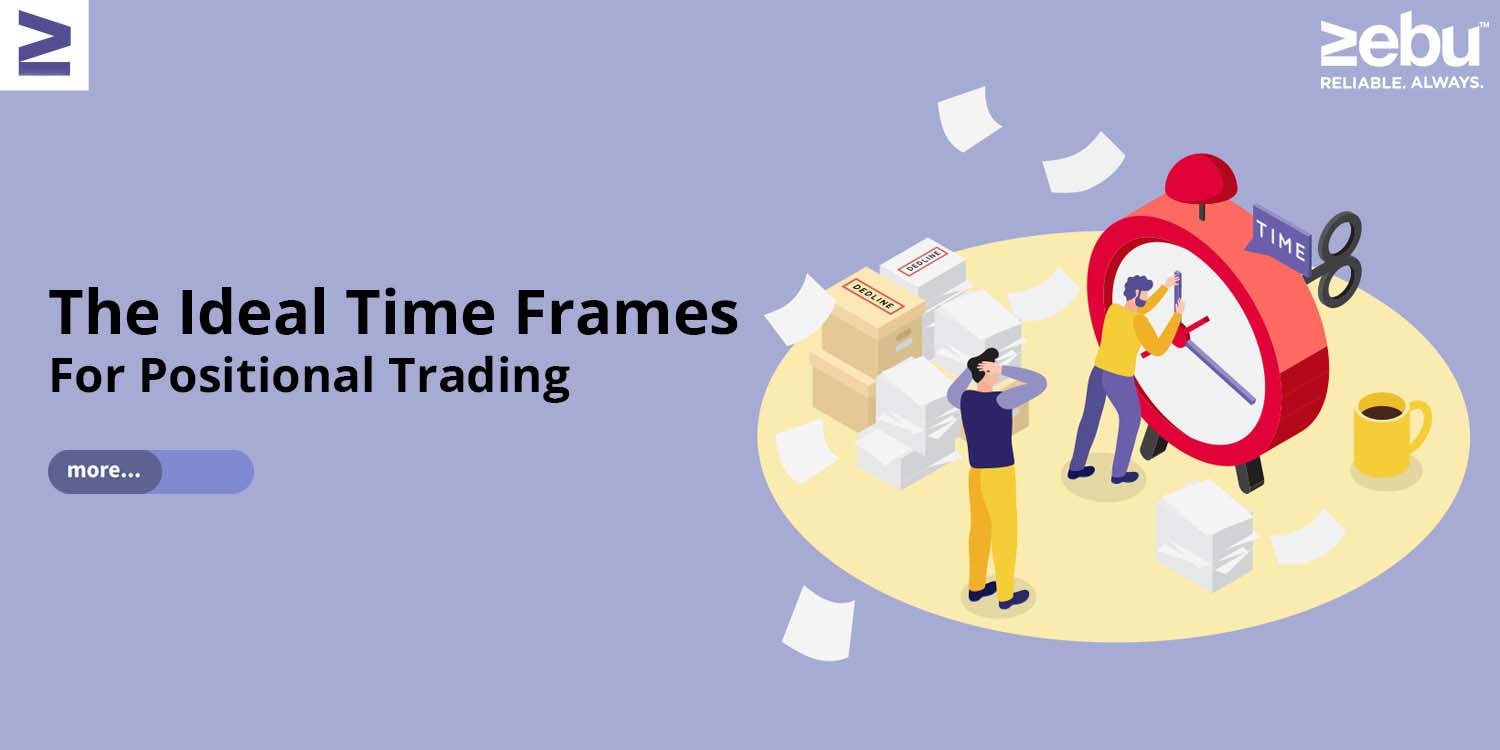
  • The Ideal Time Frames For Positional Trading

    Positional trading is a popular strategy among traders, who aim to hold onto their positions for a longer period of time in order to capture larger price movements in the market. The time frame that is ideal for each strategy also depends on the individual trader and their risk appetite. In this blog post, we will explore the different time frames that positional traders use, and help you decide which one may be best for your trading style.

    Short-term Time Frame:
    Short-term positional traders typically hold their positions for a few days to a few weeks. This time frame is best suited for traders who have a high level of risk tolerance and are able to react quickly to market changes. For example, short-term traders use shorter time frames to enter and exit the market. The disadvantage of short-term positional trading is that the market can be extremely volatile, making it difficult to predict price movements.

    Medium-term Time Frame:
    Medium-term positional traders hold their positions for a few weeks to a few months. This time frame is best suited for traders who have a moderate level of risk tolerance and are able to react to market changes within a reasonable time frame. Medium-term traders often use a combination of technical and fundamental analysis to make their trading decisions. The advantage of medium-term positional trading is that the market tends to be more stable than the short-term market, making it easier to predict price movements, especially during more volatile time periods.

    Long-term Time Frame:
    Long-term positional traders hold their positions for a few months to a few years. This time frame is best suited for traders who have a low level of risk tolerance and are able to wait for the market to move in their favor. Long-term traders often use fundamental analysis to make their trading decisions, as they are able to identify long-term trends and patterns in the market. The advantage of long-term positional trading is that the market tends to be the most stable, making it easier to predict price movements. However, the disadvantage of long-term positional trading is that it can take a significant amount of time to see a return on your investment.

    In conclusion, the time frame that a positional trader uses depends on their risk tolerance and investment horizon. Short-term traders are best suited for traders who have a high level of risk tolerance, medium-term traders are best suited for traders who have a moderate level of risk tolerance, and long-term traders are best suited for traders who have a low level of risk tolerance. It is important to understand the advantages and disadvantages of each time frame before making a decision, and to always use a sound trading strategy and risk management plan.

    In addition to the different time frames discussed above, it’s important for positional traders to also consider their overall trading strategy and risk management plan. For example, a short-term trader may use a scalping strategy, where they aim to make small profits on a large number of trades. A medium-time frame trader can also use these strategies to manage entries and exits in the short term. A long-term trader may use a buy-and-hold strategy, where they aim to hold onto their positions for an extended period of time in order to capture long-term trends in the market.

    Another important consideration for positional traders is their use of leverage. Leverage allows traders to control a large amount of capital using a small amount of their own money. However, as usual, traders should keep a close eye on their positions based on their risk appetite. Therefore, it is important for traders to carefully consider the amount of leverage they are using and to have a risk management plan in place.

    In addition to technical and fundamental analysis, positional traders may also use other tools and indicators to help inform their trading decisions. For example, traders may use moving averages, relative strength index (RSI), or Bollinger bands to identify trends and patterns in the market. It is important for traders to have a good understanding of these tools and indicators, and how to use them effectively.

    In conclusion, the time frame that a positional trader uses is an important consideration, but it is not the only one. Traders should also consider their overall trading strategy, risk management plan, and the use of leverage and other tools and indicators. By taking all of these factors into account, traders can increase their chances of success and make more informed trading decisions.

  • Combining Open Interest Analysis With Other Indicators

    Trading on the stock market can be difficult and unpredictable, but if you have the right tools and knowledge, you can make smart decisions and possibly make a lot of money. Indicators, which are mathematical calculations used to analyse and predict how the market will move, are one of the most important tools for traders. In this blog post, we’ll talk about what indicators are and how they can be used with open interest analysis to learn more about the market and make better trading decisions.

    First, let’s talk about what signs are. Indicators are numbers that are calculated based on a security’s price and/or volume. There are many ways to do these calculations, such as using moving averages, the relative strength index (RSI), and stochastic oscillators. Each indicator is made to tell you a certain thing about the security being looked at, like its trend, momentum, or volatility.

    The moving average is one of the most used kinds of indicators. A moving average is a calculation that uses the average closing price of a security over a certain number of periods (e.g. days, weeks, or months). The result of this calculation can then be plotted on a chart to show the trend of the security. For example, a 50-day moving average shows the average closing price of a security over the last 50 days, while a 200-day moving average shows the average closing price over the last 200 days. Traders often use two moving averages, one with a shorter time period and one with a longer time period, to spot possible changes in trend.

    The relative strength index is another widely used measure (RSI). RSI is a momentum indicator that looks at how big a stock’s recent gains are compared to how big its recent losses are. The result is a number between 0 and 100. A value of 70 or above means that a security is overbought, and a value of 30 or below means that it is oversold. RSI can be used to figure out when it might be a good time to buy or sell.

    Stochastic oscillators are another tool that traders use a lot. These indicators compare the closing price of a security to its price range over a certain time period. The result is a number between 0 and 100. Readings above 80 show that a security has been bought too much, while readings below 20 show that it has been sold too much.

    Open interest analysis is one of the most important tools for traders. Open interest is the total number of contracts that are still open in a market. This is important because it can show how busy the market is with buying and selling. When open interest goes up, it’s usually a sign that more money is coming into the market, which is a bullish sign. On the other hand, when the number of open positions goes down, it is usually seen as a sign that investors are pulling money out of the market.

    When indicators and open interest analysis are used together, they can give a more complete picture of the market. For example, if a trader sees that a stock’s RSI is overbought but that open interest is going up, this could mean that the stock is in a strong uptrend and that it is not yet time to sell. On the other hand, if a trader sees that a stock’s RSI is oversold but that open interest is falling, it may mean that the stock is in a weak downtrend and that it is not yet time to buy.

    In the end, indicators and open interest analysis are powerful tools that can help stock market traders make better decisions. By knowing how to use these tools and how to read the information they give, traders can learn more about the market and maybe make more profitable trades. But it’s important to keep in mind that indicators and open interest analysis should be used with other types of analysis, like fundamental and technical analysis, to get a full picture of the market. Also, it’s important to remember that indicators and open interest analysis don’t guarantee profits, and it’s important to have a well-rounded trading strategy that takes into account different market conditions.

    It’s also important to remember that no indicator is perfect and that all of them have a certain amount of lag. Traders shouldn’t rely on a single indicator; instead, they should use multiple indicators and combine them with other types of analysis to confirm the signals they give. Also, you should try out different indicators and settings to find out which ones work best for a particular market or security.

    In conclusion, traders can use indicators and open interest analysis to learn more about the stock market. Traders can learn more about the market and make better trading decisions by using a combination of indicators, open interest analysis, and other types of analysis. But it’s important to remember that indicators and open interest analysis don’t guarantee profits, and it’s important to have a well-rounded trading strategy that takes into account different market conditions.

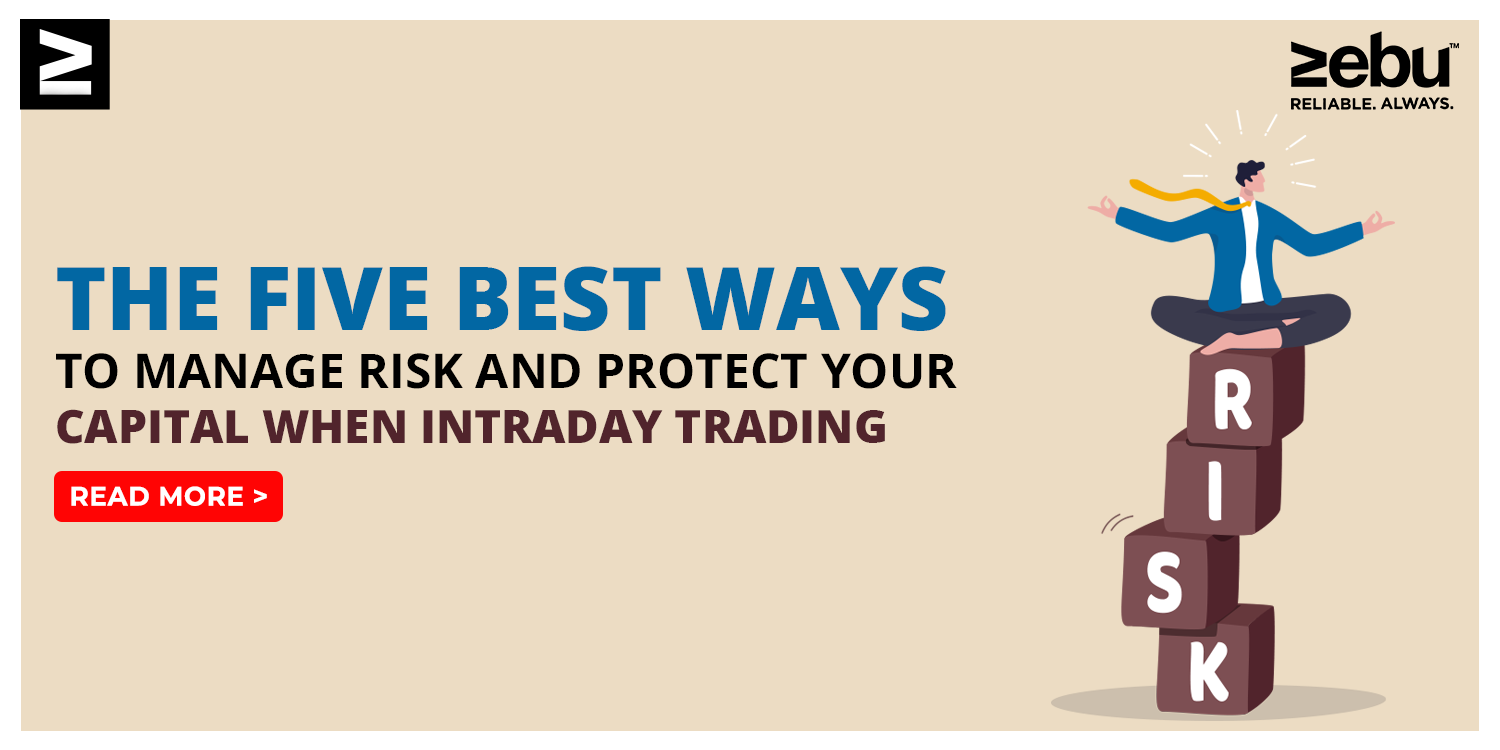
  • The five best ways to manage risk and protect your capital when intraday trading

    Intraday trading, also known as day trading, is a popular trading strategy that involves buying and selling securities within the same day. While this type of trading can be a lucrative way to make money, it also comes with a certain amount of risk. In this article, we will take a look at the five best ways to manage risk and protect your capital when intraday trading.

    Use stop-loss orders: A stop-loss order is an order to sell a security if it falls to a certain price. This can be a useful tool for intraday traders because it allows them to limit their potential losses on a trade. For example, if you buy a stock for Rs 50 and place a stop-loss order at Rs 48, the stock will be sold automatically if it falls to Rs 48, preventing you from losing any more money on the trade.

    Trade with a plan: Before you enter any trade, it’s important to have a plan in place. This means knowing exactly why you are buying or selling a particular security and what your exit strategy will be. This can help you stay focused and disciplined during the trade, which can in turn help you manage your risk.

    Use risk-management techniques: There are several techniques that you can use to manage your risk when intraday trading. One of the most popular is called the “1% rule,” which states that you should never risk more than 1% of your capital on any single trade. This can help you avoid taking on too much risk and protect your capital.

    Diversify your portfolio: Diversification is a key principle of risk management. By investing in a variety of different securities, you can reduce the overall risk of your portfolio. This means that if one of your trades goes bad, it won’t have a major impact on your overall performance.

    Keep a trading journal: A trading journal is a record of your trades, including the reasons why you made them and how they turned out. This can be a valuable tool for intraday traders because it allows them to track their performance and identify areas where they can improve. By regularly reviewing your trading journal, you can gain a better understanding of your own strengths and weaknesses as a trader and make more informed decisions in the future.

    In conclusion, intraday trading can be a profitable way to make money, but it also comes with a certain amount of risk. By using stop-loss orders, trading with a plan, using risk-management techniques, diversifying your portfolio, and keeping a trading journal, you can manage your risk and protect your capital when intraday trading.

  • Rules That Every Intraday Trader Should Follow

    By following a few simple rules, an intraday trader who is just starting out can increase their chances of making money and decrease their chances of losing money. Here are some of the rules that you must know.

    Don’t use your full capital:

    Even if you like the excitement of the stock market, it’s not a good idea to put a lot of your money into “intraday trading.” Don’t put in more than you can afford to lose. Don’t put more money into trading than you can afford to lose, even if other traders are doing well.

    Exit at the end of the day:

    Always close out your trades at the end of the day. Do not keep holding onto securities in the vain expectation of making more money or minimising losses the following day. This rule is applicable especially if the general climate of the market indicates volatility.

    Watch the market at all times:

    You can’t have all-day business meetings or long flights when the market is open. You have to be quick and aware to make the deal when the price is right. If you don’t keep track of how your chosen stocks rise and fall, you might miss out on a good selling price.

    Exit as soon as the trend goes against you:

    As soon as you realise that the market has gotten worse, you should get out. If you wait until the stop-loss conditions are met, it may be too late and cause you to lose more money. With experience, you can become a discretionary trader instead of a systematic trader.

    Don’t put money into too many marketplaces at once:

    Based on the quantity of capital you have, choose your market. Most of the time, you need the least amount of money to trade on the currency market, while you need a little more money to trade on the stock market.

    Find the best time for trading during the day and stick to it:

    Develop and use a good intraday trading strategy over time and with more knowledge. Intraday trading is all about finding a method that works for you and using it over and over again to make more money.

    Stocks that are good for intraday trading should have volatility that ranges from moderate to high and be easy to buy and sell. For a beginner, it’s best to start by focusing on just one or two stocks at a time.

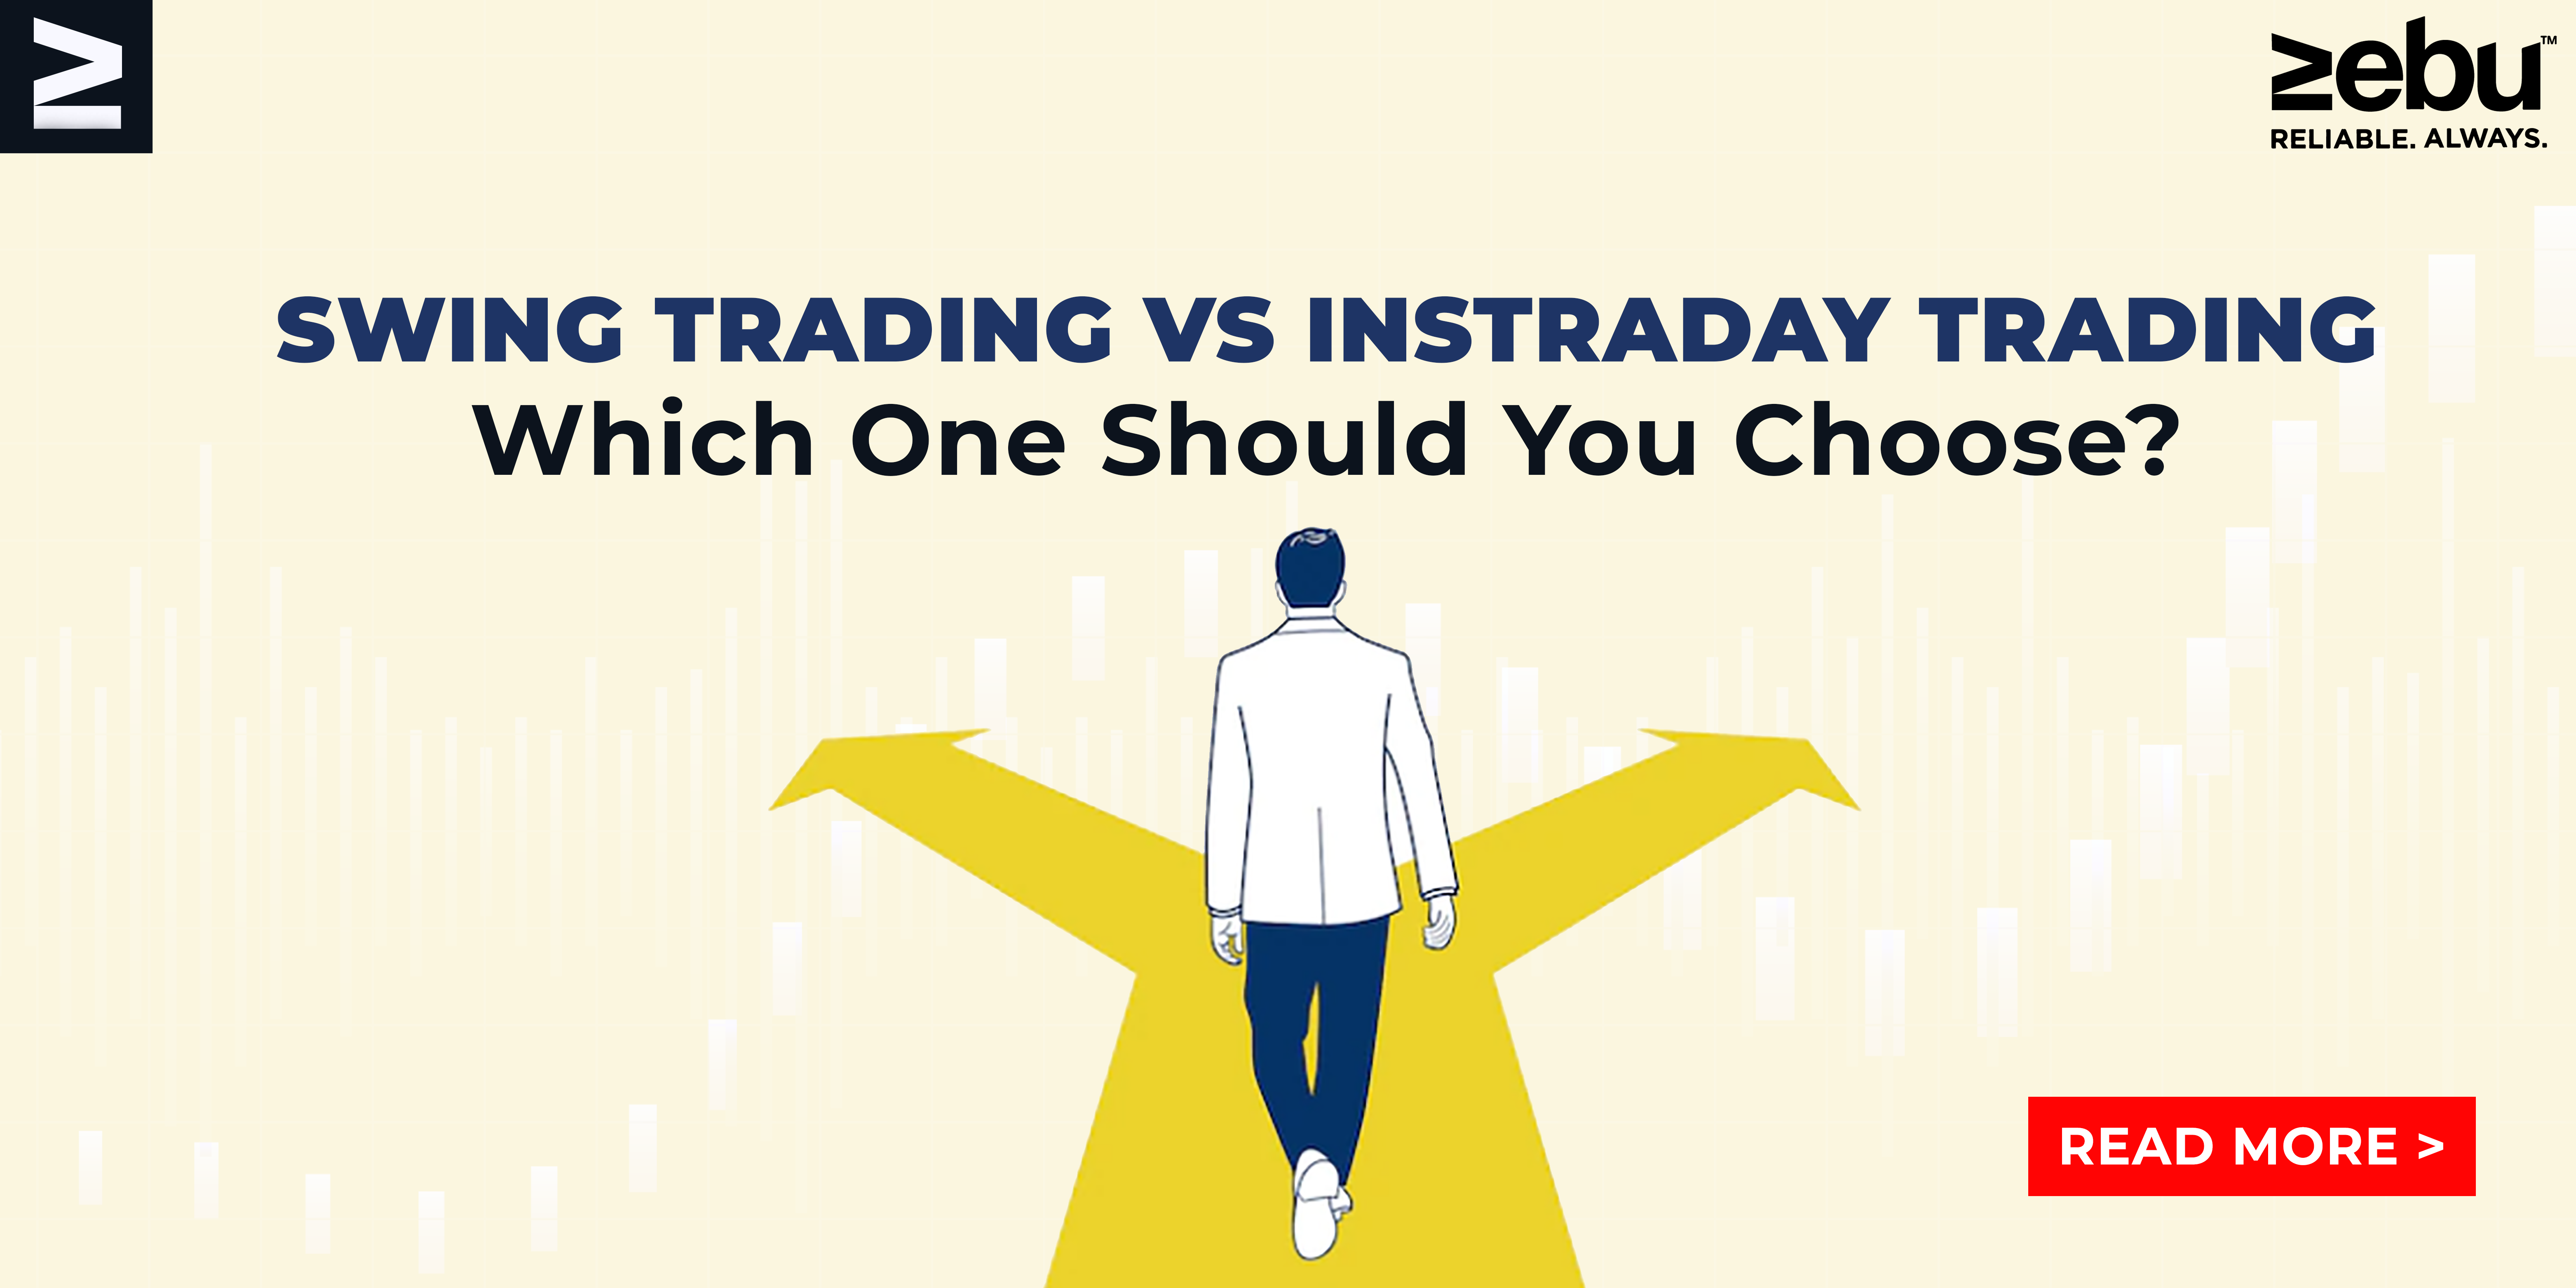
  • Swing Trading Vs Intraday Trading – Which One Should You Choose?

    Let’s start by understanding the different ways of trading. The main differences between the two ways of trading are investment, commitment, and time. Traders choose different trading strategies based on time, money, and psychological factors.

    Intraday Trading

    The Financial Regulatory Authority (FINRA) says that day traders are people who do many “round trips,” at least four of which happen every five days. Day trading might be the most common way to trade. Most traders are day traders, which means they make money from the price changes on the market during the day. All-day trading takes place in a single day, as the name suggests. Traders open a number of positions during trading hours, which they all close before the end of the day.

    Day traders use technical analysis and tools to get real-time updates. They often trade full-time and keep a close eye on the market for business opportunities. At least in terms of percentages, day trading gives people with small trading accounts more chances to make money. They don’t try to make a lot of money from one trade. Instead, they should do a number of transactions to make enough money.

    In the end, day trading is a type of high-frequency trading that involves small amounts and always buys stocks for less than what they sell for.

    Swing Trading

    The main difference between day trading and swing trading is the length of time. During a swing trade, days or weeks can go by. Swing traders don’t make a trade until they see a pattern. They don’t trade full-time, but they use both fundamental and technical research to spot trends as they happen and trade in line with them. They would look for stocks that could make them the most money quickly. There is more risk, but there is also more chance of making money.

    Differences between day trading and swing trading that are important to know

    Swing trading and day trading are both types of trading, but they are not the same. Here are some of the most important differences between the two ways of trading.

    • Day traders buy and sell a lot of different stocks in the same day. Swing traders buy and sell a number of stocks over a longer time period (usually between two days to several weeks). So that they have a better chance of making money, they look for a pattern of trends.

    • Day traders will close out all of their positions before the closing bell rings. Swing traders would hold their position for at least one night before settling it the next day.

    • Swing traders only work for a few hours each day. They don’t spend the whole day tied to their computers. Day trading takes a lot of time and commitment.

    • Day traders make a lot of trades every day, which increases their odds of making money. Gains and losses, on the other hand, are smaller. Swing trading has fewer wins and losses, but they are often bigger.

    • Day traders need the newest hardware and software. Day traders must have extremely rapid trigger fingers. You don’t need complicated or cutting-edge software to do swing trading.

    A trader’s main goal is to make as much money as possible. So, between swing trading and day trading, which is better?

    Even though both ways of trading have many pros, you should be aware of their cons before choosing one. The list that follows goes over the pros and cons of each one.

    • Swing trading needs less attention because it takes place over a longer period of time. Day trading, on the other hand, requires regular market watching and quick decisions.

    • Day traders try to make as many trades as possible to make the most money in a single day, while swing traders try to make a big profit.

    • Swing traders take on more risk when they leave their position open overnight. On the other hand, day traders close their trades at the end of the day. So, there is no longer any risk.

    Swing traders wait until a deal has been going on for a while before using that time to watch how the market moves. It helps make things safer. Day trading is easier for most traders to do because it needs less capital than swing trading. Day traders have to make trades quickly because one loss could wipe out their whole day’s profit.

  • What Should You Consider While Backtesting A Strategy – Part 2

    Sharpe Ratio: The risk-adjusted returns, or reward-to-risk ratio, is found by dividing the annualised return by the annualised volatility.
    With the Kindino Ratio, negative returns are taken into account by dividing the annualised return by the annualised volatility of negative returns.

    In the last section, we talked about how volatility was a way to measure risk. We have these two measurements because we know that not all risks are bad. Sharpe looks at all kinds of volatility, while Sortino only looks at downside volatility. Here is where they part ways. Most of the time, you want a high Sharpe and a high Sortino.

    The right way to count costs

    When analysing trading techniques, it’s also important to think about how much it costs to make the trades that need to be made. One of the main reasons for this is that beginners often think their techniques are better than they really are.

    Many quants think that the only costs of a trading strategy are the commissions that have to be paid to brokers. Two more important examples are:

    Commissions

    As you may already know, it’s hard to trade without a broker. In exchange for money, brokers provide transaction services and act as an exchange. Brokers sometimes add on extra costs and fees that you might not expect. This includes any extra services, fees set by the exchange, and taxes the government might charge for the financial transaction.

    Slippage

    Slippage is a key feature that is often overlooked when evaluating. Slippage is when the price you wanted to trade at is different from the price you actually trade at.

    Why do these prices vary from each other? There could be many things going on. For example, you might have wanted to buy 100 shares of Apple at $100 each, but only 50 people were willing to sell at that price and another 50 at $101. Your loss would have been 50 cents, and the price you would have traded at is 100.50.

    Slippage, which is part of transaction costs, can quickly turn a strategy that should be profitable in theory into one that doesn’t work. In the previous example, if you had planned to sell your shares for 102 dollars, slippage would have cut your profit by 25%. Slippage can be reduced by making a good plan for execution, but it’s important to know how it might affect your deals.

    A few words about the biases we all have

    Everything comes from within, including both profit and loss. Even though the market and how volatile it is play a big role in how much money we make or lose, we always let an inner voice guide us when we make a trade. Some of these voices can be helpful, but most of the time they come from people’s biases. We often feel a wide range of emotions and have to make decisions we weren’t supposed to make because of these kinds of personal biases. We need to control our emotions and personal preferences if we want to know when to stop a trade and when to keep going with it.

    We can’t make good decisions when we’re feeling a lot of different emotions, so these are important things to look at when judging a trading strategy. Some emotions that can make it hard to think straight are excitement, thrill, hope, fear, worry, and panic. These are the emotions that drive us, so keeping an eye on them when it makes sense will always help us do better in a trade.

    If you want more information on this, we also have a page about biases in backtesting and risk management. This will tell you more about your own biases and how to avoid them so you can trade better.

    Most of the time, these are some of the things that are used to judge a trading strategy. Don’t be afraid to write things down as you try to use them in your plan. Once you’ve looked at the results, you can start making changes to improve the way your transactions work.

  • What Should You Consider While Backtesting A Strategy – Part 1

    Backtesting is a very useful way to figure out how our trading algorithms might work in real life (might is the key word). But it can be hard for a data scientist who doesn’t have a background in finance to understand what it all means. Sharpies or Sortinos? Returns or profitability with money? This shouldn’t stop you, though, because some of the best funds in the world are run by people who aren’t in finance. Instead, it’s time to learn.

    In this article, we’ll talk about some of the most important ways to tell if your trading strategy is working or not. If you really understand these basic indicators, you’ll have a good basis for judging different strategies.

    Setting Up Performance Measures

    These are some of the first criteria or measures you could use to figure out how well your trades are going. Most of the time, the measurements focus on two important parts of a strategy: the change in the value of the portfolio and the risk of making those gains or losses. By understanding these two things, you can figure out what it does well and where it falls short.

    Financial metrics

    All of the metrics in this section tell you how much money you made (or lost) when you used a certain strategy. The final amount of money is a good place to start, but there are other signs that give us more information:

    Annualized Return: The average annual percent profit from your trading strategy (or loss).

    Win/Loss, Average Win/Loss: Total (or Average) (or Average) Profits from Trades That Work The total (or average) amount of money lost on trades that go wrong.

    % Profitability is the number of profitable trades out of all of them.

    When we talk about return on capital as a percentage, we usually mean that the strategy is a multiplier on your initial capital. This is helpful most of the time, but we should remember that it’s only partly true.

    Next, if we want to fully understand a strategy, we need to know how we are making money. For instance, do we consistently make tiny wins or do we consistently make small wins followed by massive losses? By looking at different combinations of profitability, win/loss, and profit/loss, we might start to understand how our plan will work.

    Metrics that focus on risk

    It’s just as important to see big profits as it is to know that the method could lose money in the long run. “No risk, no reward” is a saying that only winners use. The vast majority of people whose risky bets didn’t pay off don’t say it. Here, the following crucial metrics are important:

    Annualized Volatility: The standard deviation of the model’s daily return over a year. Since volatility is used to quantify risk, a model with a higher vol indicates greater risk.

    Highest Drawdown: The most negative change in the value of the whole portfolio or the biggest drop in PnL. It is based on the biggest difference between the high and the next low before a new high is set.

    Since our backtest will always cover the whole period, drawdown is an important risk factor to think about, but we’re much less likely to keep a losing trade open in real life. If you had bought Amazon stock in 1998, it would have been smart to keep every share and buy as much as you could during the dotcom bust. In reality, not many people would keep going with a deal if their money dropped by 10%, 20%, 40%, 80%, etc.


  • How To Trade With Support And Resistance


    Title Page Separator Site title

    Technical analysts use a number of rules to predict how much stocks will go up or down in the future. Once you know what a trend is, the next important idea in technical analysis is support and resistance.

    The theory of support and resistance

    According to technical analysis, when the price of a stock reaches certain predetermined price points, it tends to stop and move in the opposite direction.

    Support level: This is the point where the price of a stock stops going down. It’s possible that the price will go up instead of down. At this point, it is likely that the demand from buyers will be much higher than the demand from sellers.

    Resistance level: The opposite of a level of support is a level of resistance. It is a price level (ceiling) above which the stock price is not expected to rise. At this price, the market for this stock is better for sellers than it is for buyers.

    What does support mean?

    The support and resistance levels on a candlestick chart might help you figure out the target price at which to buy or sell. The support level is where the market expects more buyers than sellers. The price at which traders can expect to see the most buying interest in a stock is called the support level on the chart.

    In a falling market, the support-resistance indicator, which is an important level market player to watch for, is often a sign to buy. The support line is formed when the price of a security goes down and the demand for shares goes up.

    What is resistance?

    On a candlestick chart, a price has reached the resistance level when there are more sellers than buyers. Resistance level is a price point on the chart where traders expect to sell as much of a certain stock as they can. It keeps the price from going up even more.

    Since resistance is always higher than the current market price, it is often a sign to sell. In a bullish market, the resistance level is one of the most important things that traders pay close attention to. Support and resistance are, in a nutshell, the exact opposites of each other.

    By looking at the support and resistance levels, the trader can get an idea of how the price of a stock will move. But there is always a chance that the stock price will go above these levels. When this happens, which happens often, a new level of support and resistance is set up.

    If the support level is broken, the stock price will keep falling until it finds a new level to support it. Also, if the stock price breaks through the resistance level, it keeps going up until it hits a new resistance level.

    Resistance and Support: How Reliable Are They?

    Even though support and resistance can tell you when to buy or sell, you shouldn’t rely on them alone. Or, to put it another way, before deciding whether or not to buy or sell a certain stock, you should think about a number of other things.

    When it comes to technical analysis,
    Predicting the future price of a stock is the most important (and hard) part of analysis for a trader in the stock market. The next high (or low) price cannot be predicted with any level of reliability.

    So, the idea of support and resistance is a good way to understand how prices change. Support and resistance levels help traders make decisions because they let them see patterns.

    For example, if a trader sees that a stock has reached a support level, he could buy more shares. This is done so that the stock has a better chance of coming back. In a similar way, the trader may sell his shares and make money when the stock reaches a level of resistance.

    When a stock’s price reaches these levels, you should always be careful because the area between the support and resistance levels is known to be very volatile.

    Conclusion

    Traders can use the idea of support and resistance to spot trends in the stock market and take advantage of them.

    This doesn’t mean, though, that the stock will never go above a support or resistance level. The price of a stock can always go up or down. Also, as a trader, you shouldn’t make trades based only on these levels.